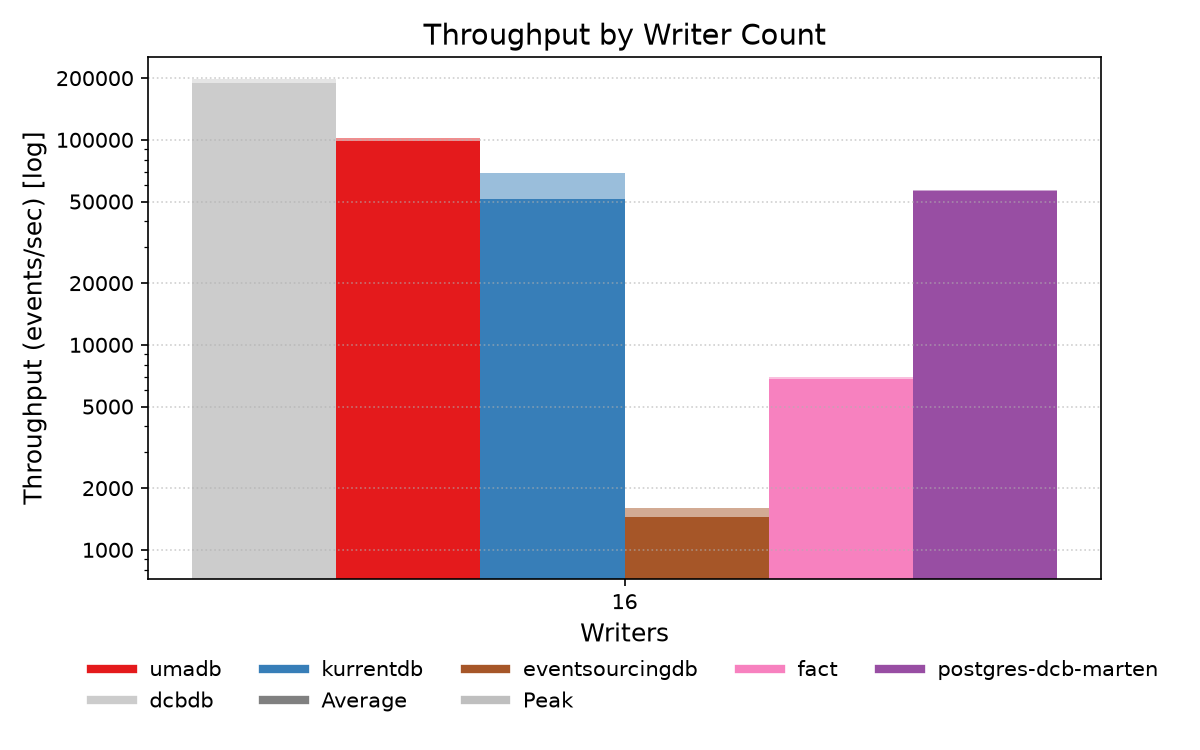
Throughput
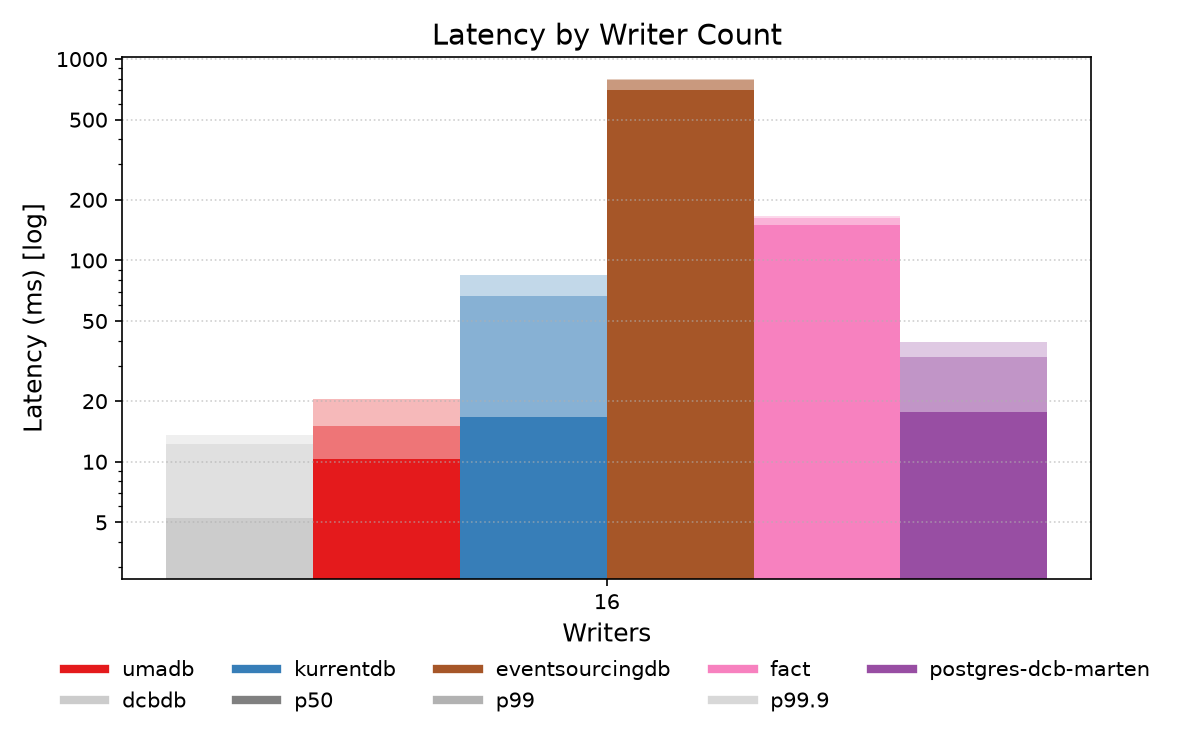
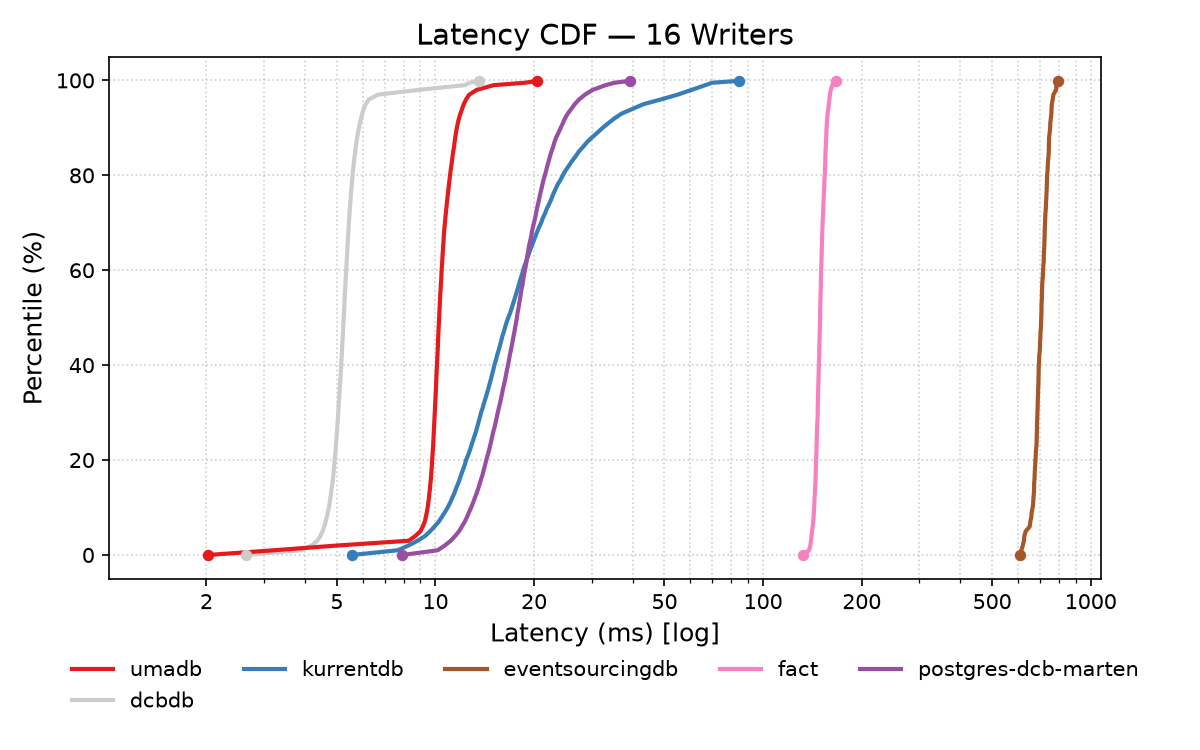
Latency
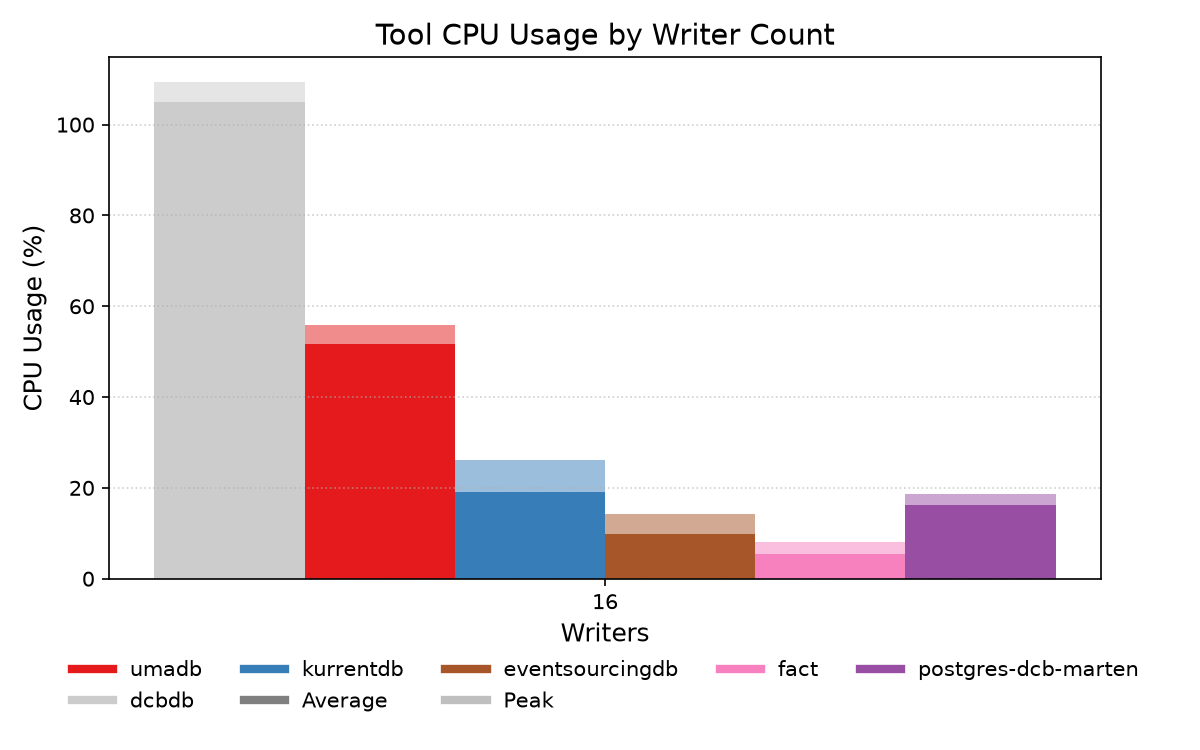
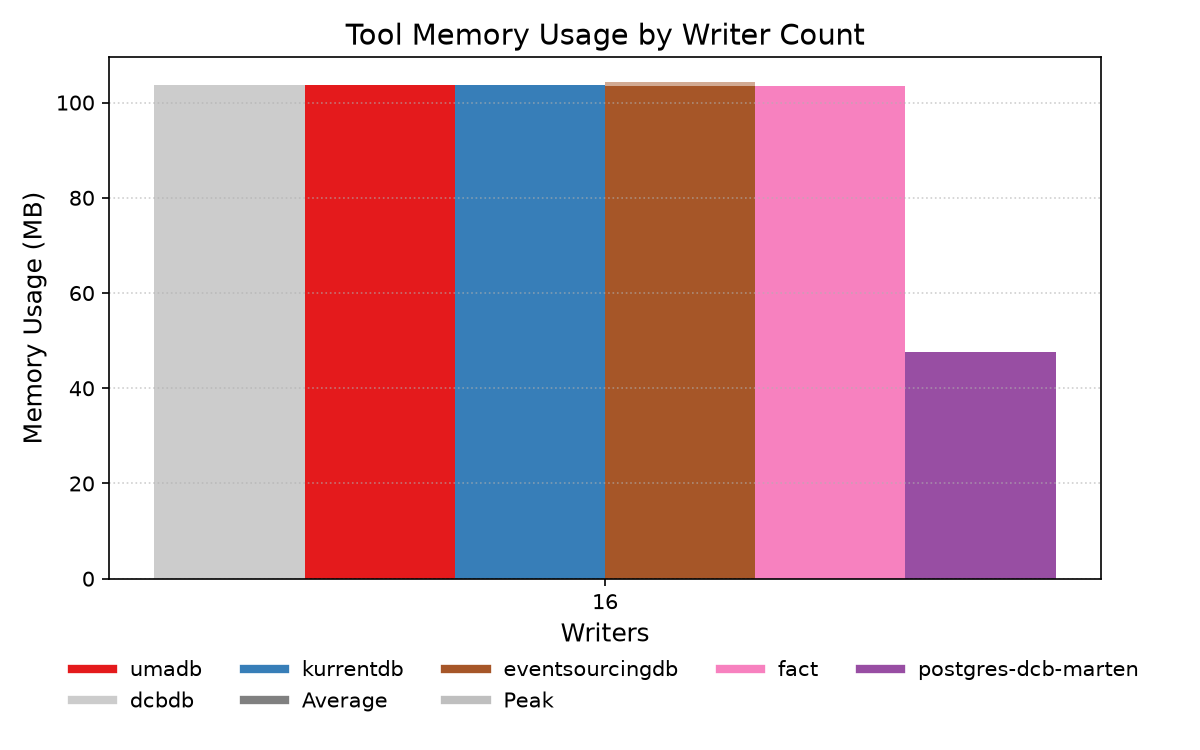
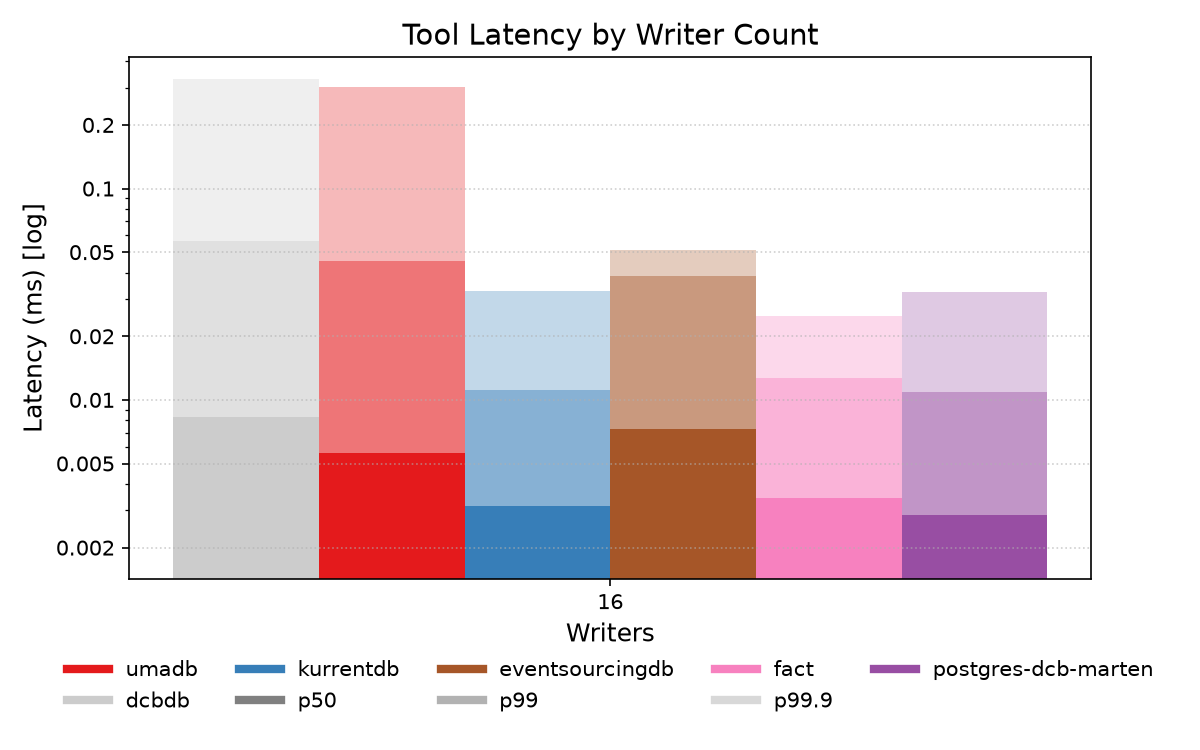
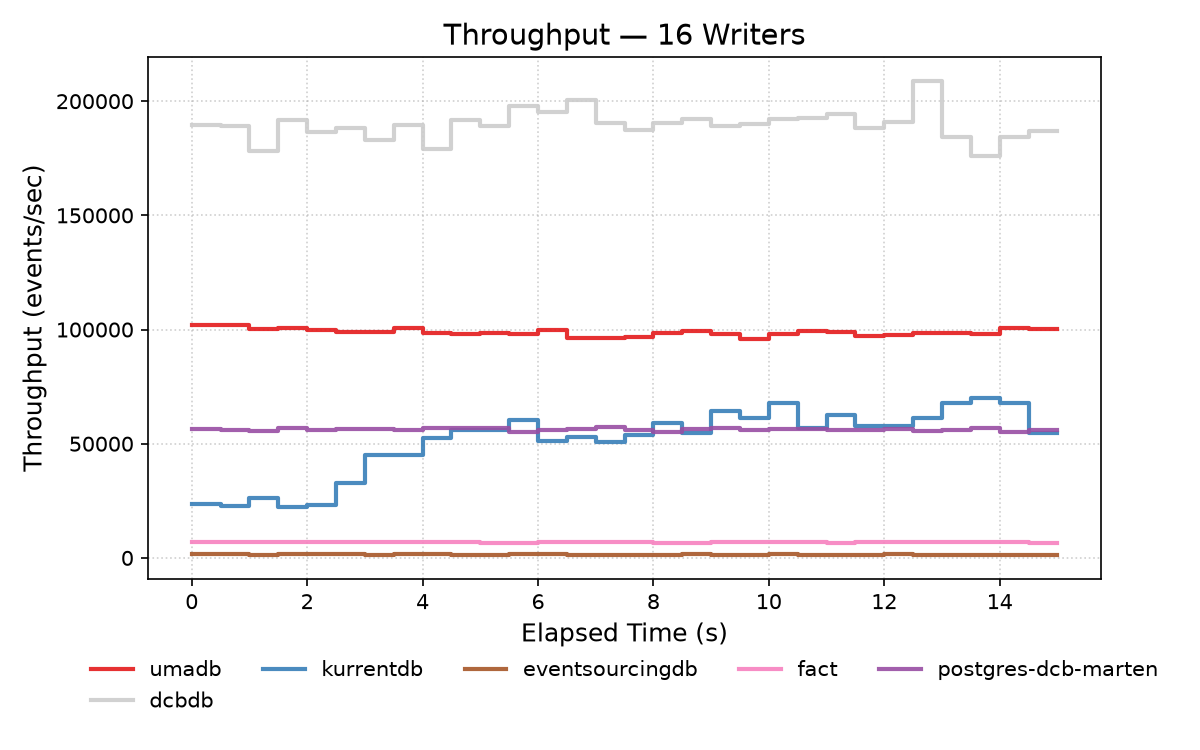
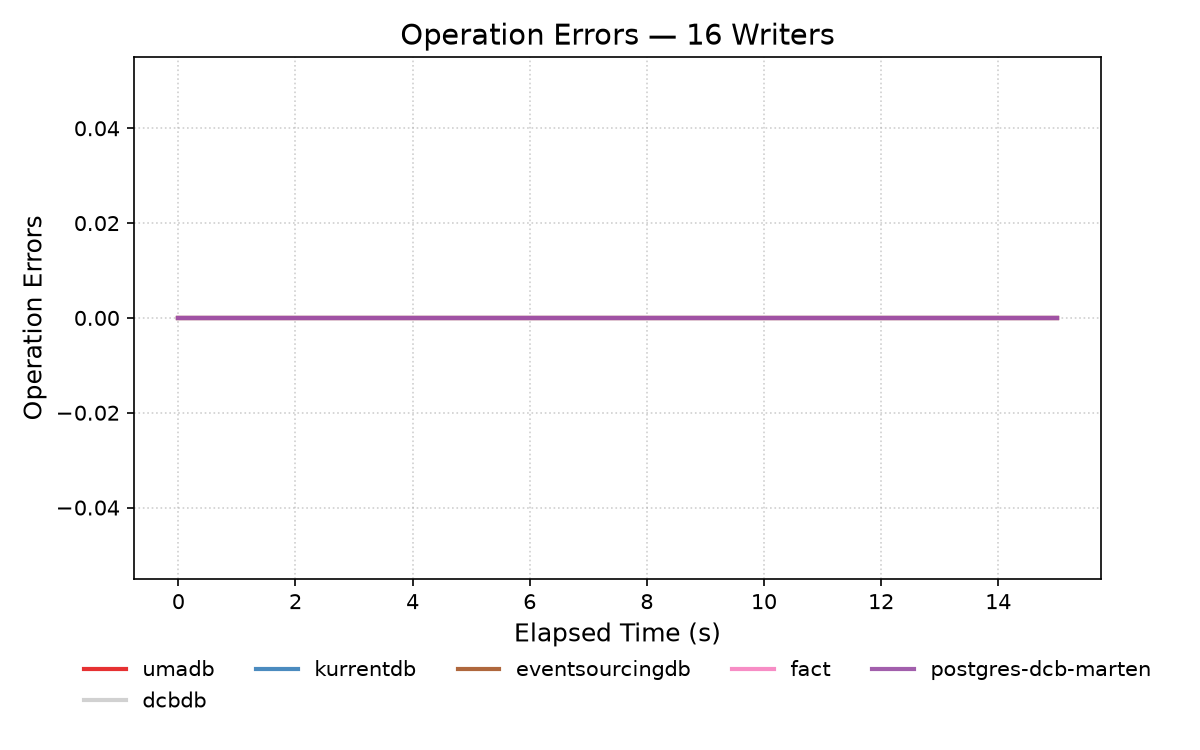
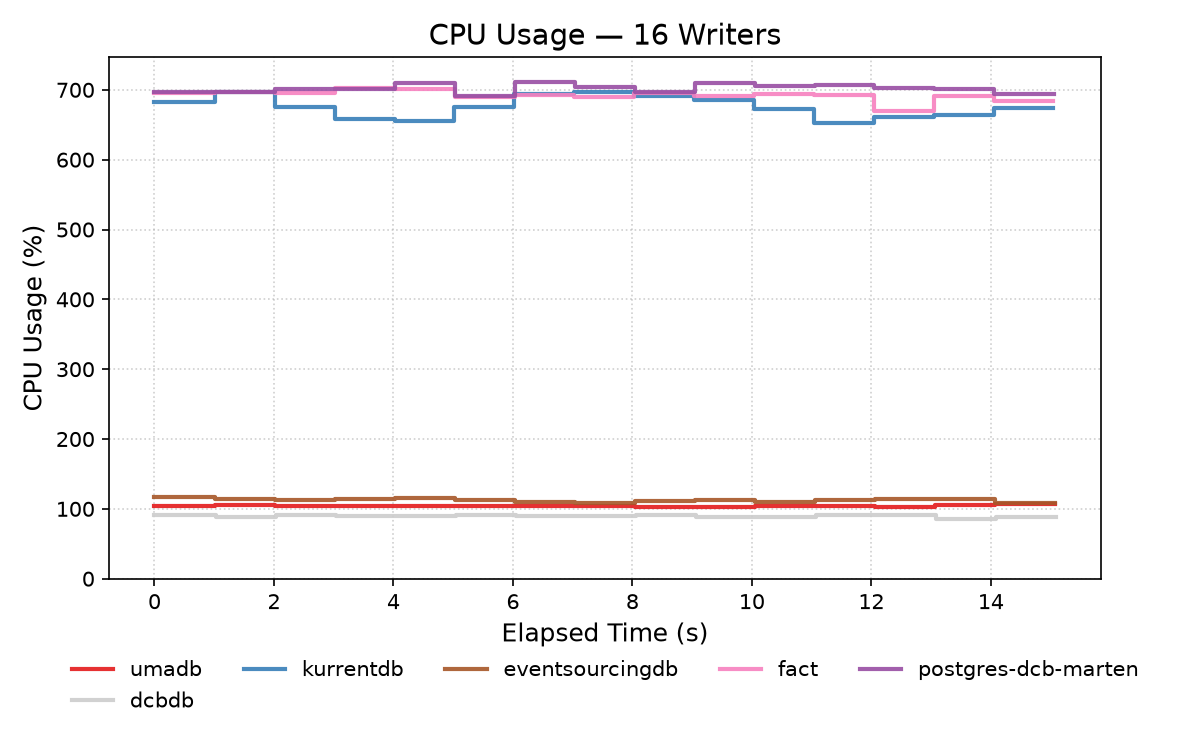
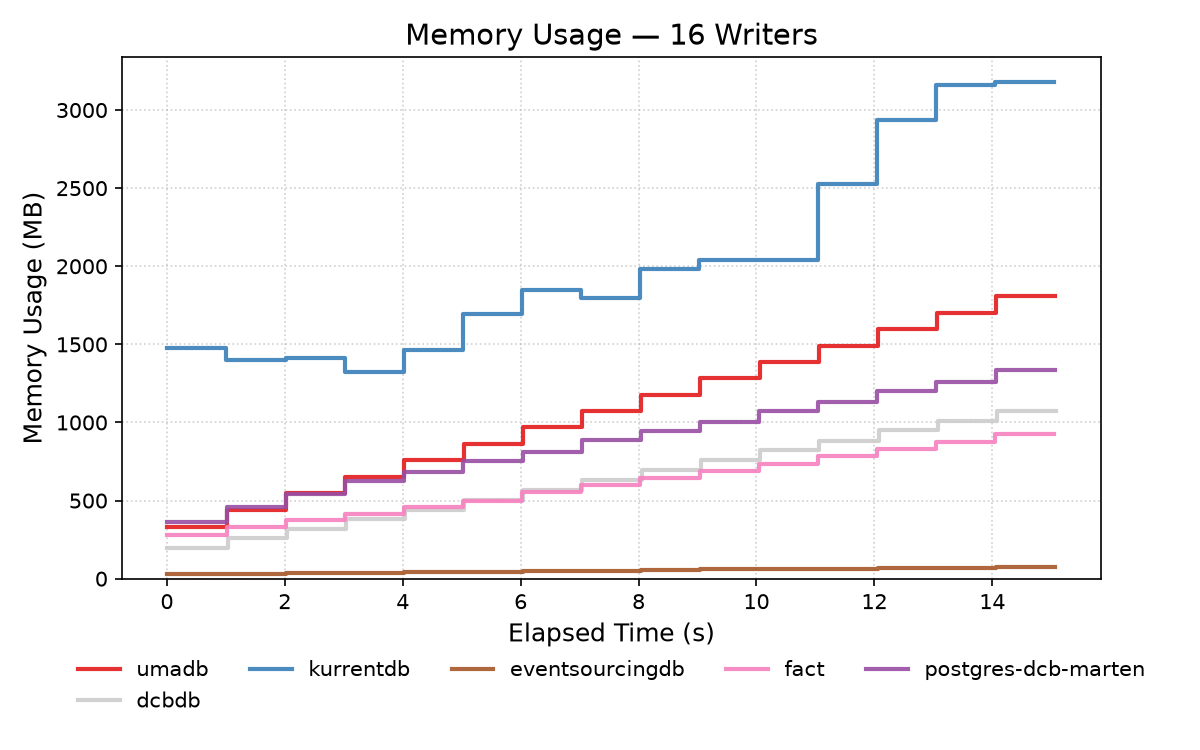
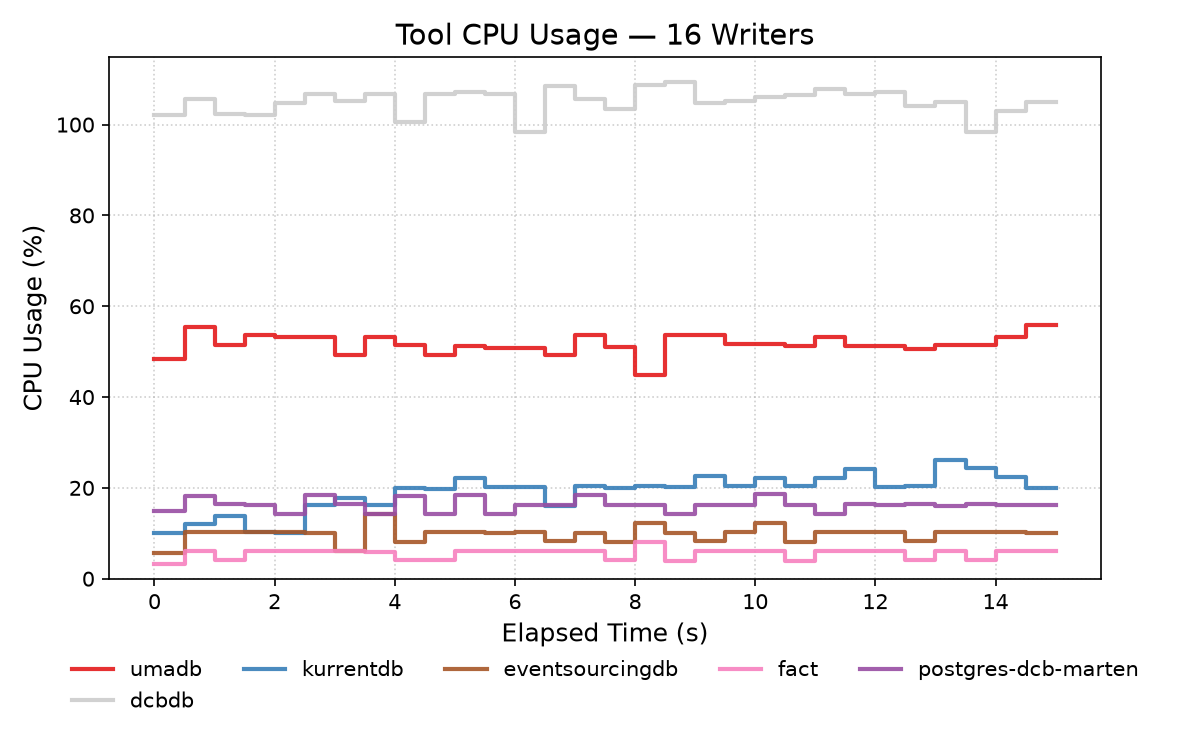
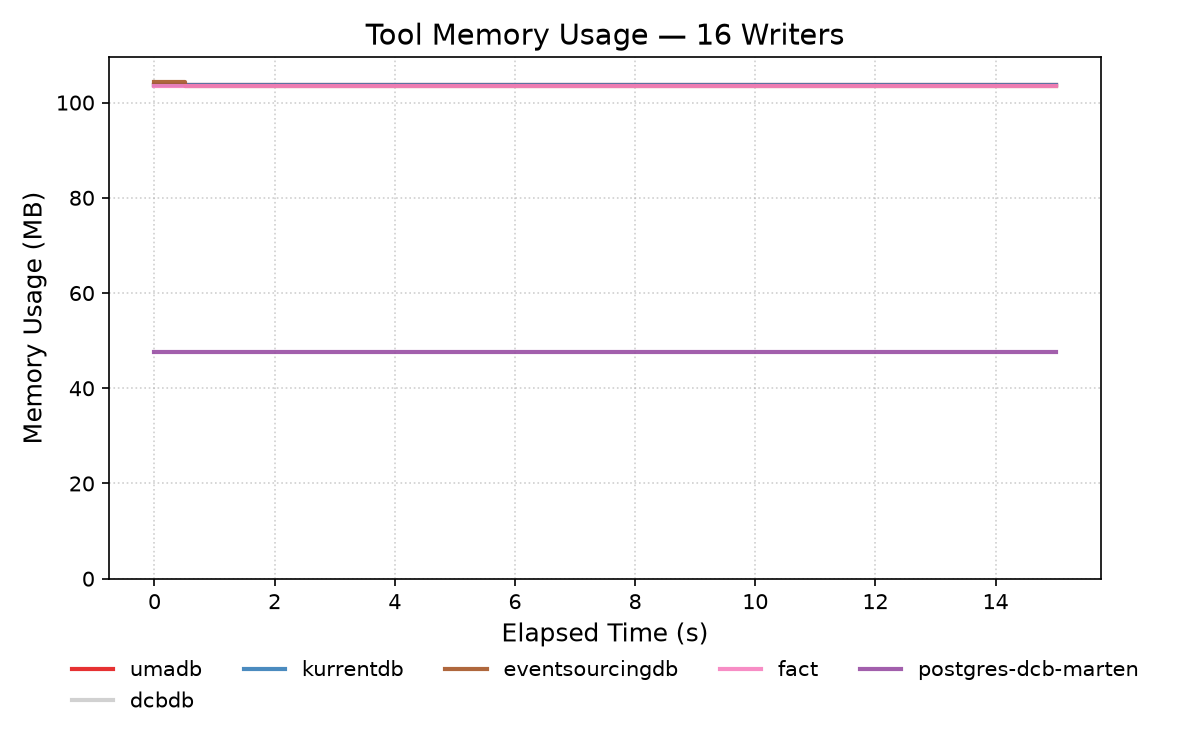
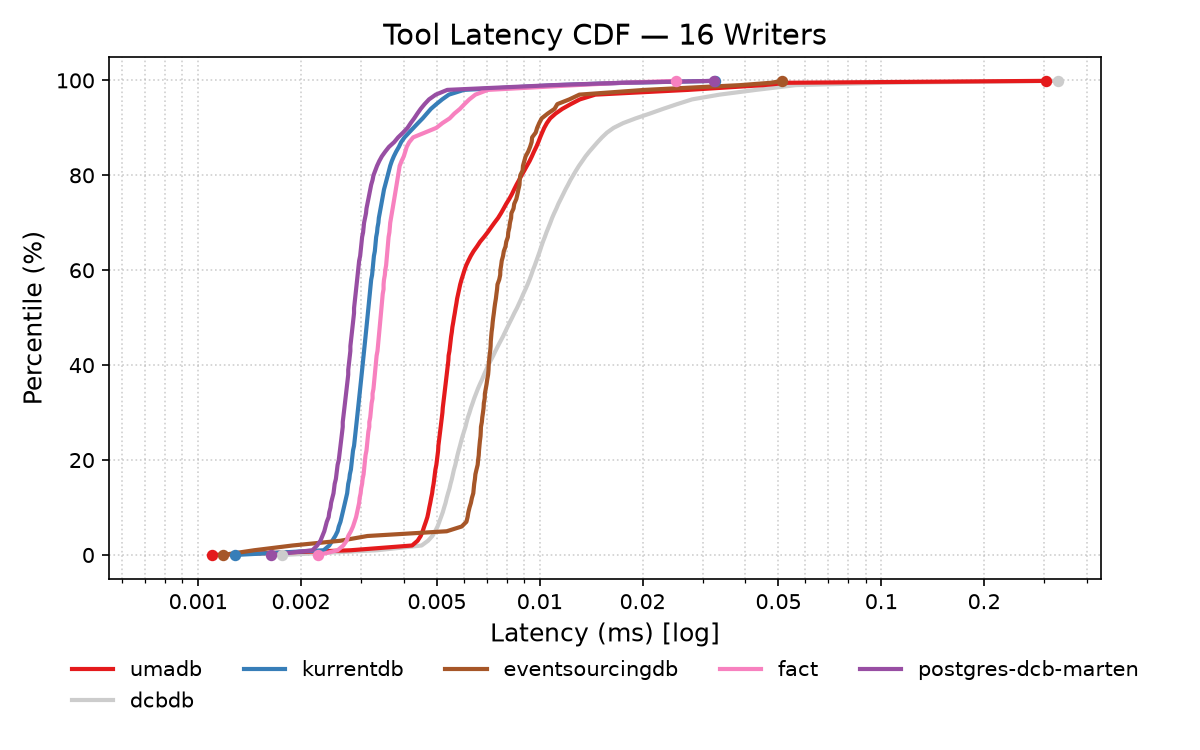
| Adapter | Writers | Throughput (eps) | Operation Errors | p50 (ms) | p99 (ms) | p99.9 (ms) | CPU (avg/peak) | Mem MB (avg/peak) |
|---|---|---|---|---|---|---|---|---|
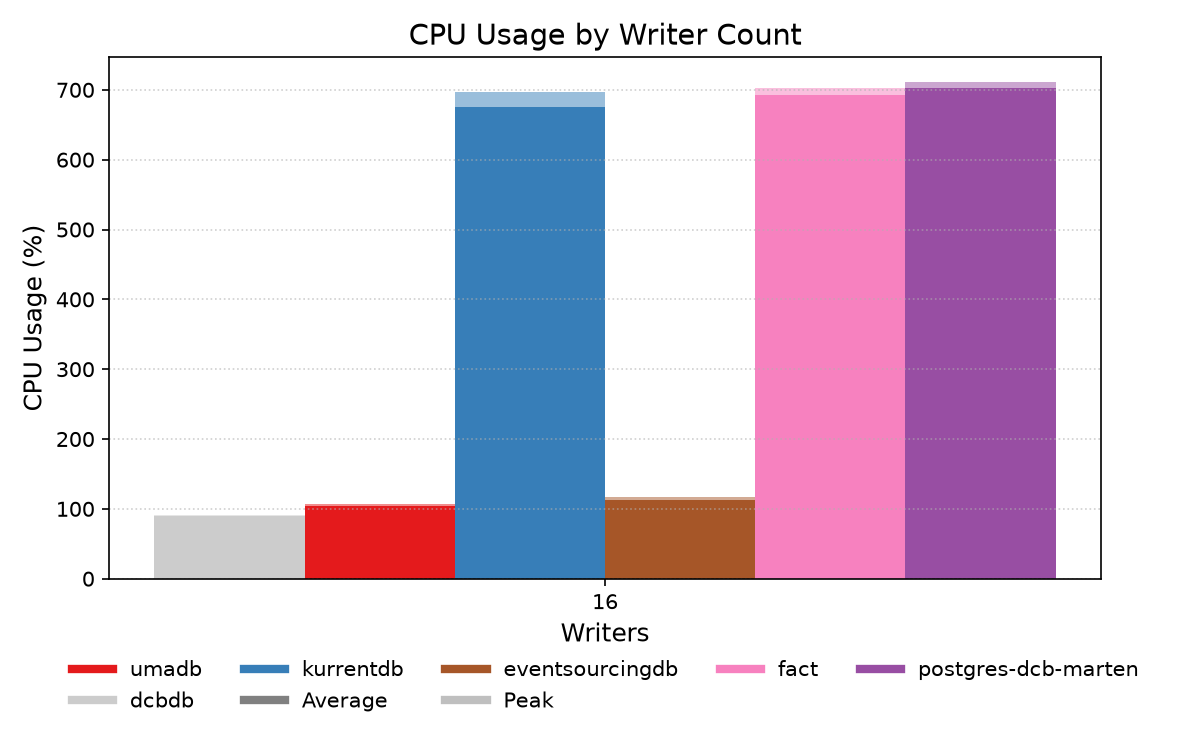
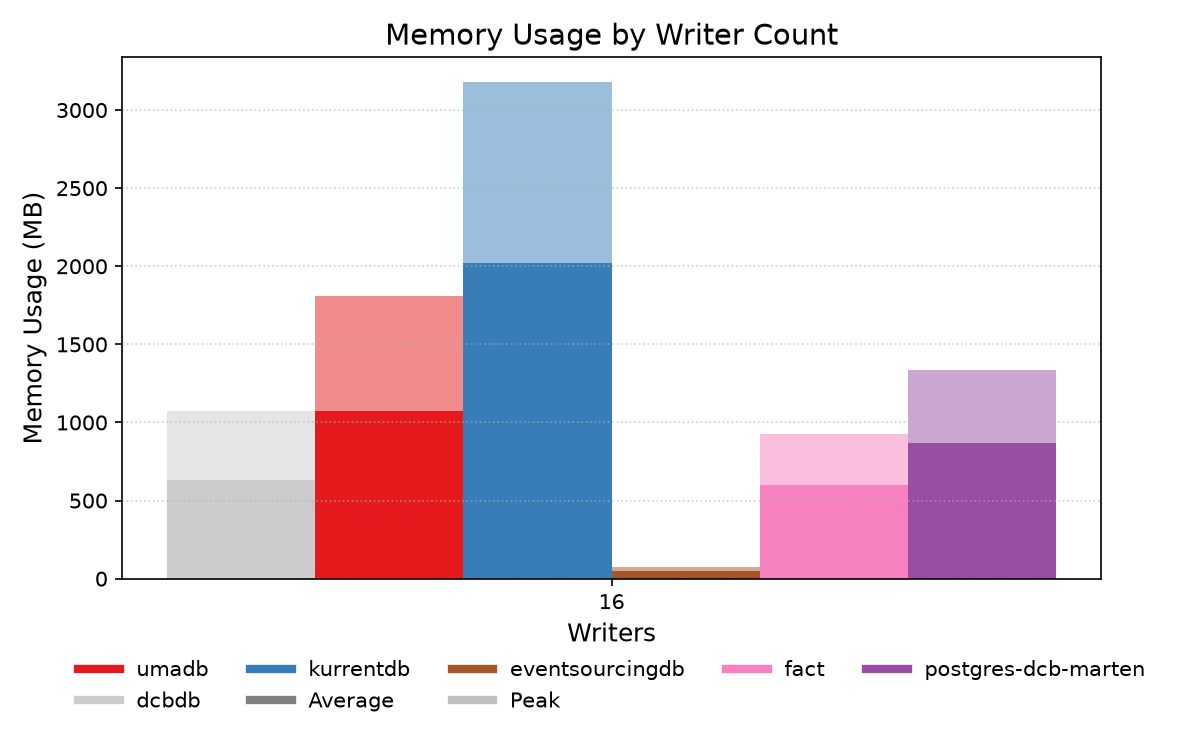
| dcbdb | 16 | 189623 / 197931 | 0 | 5.25 | 12.31 | 13.55 | 89.7% / 91.4% | 633 / 1071 |
| umadb | 16 | 98790 / 102016 | 0 | 10.26 | 15.07 | 20.48 | 104.3% / 107.1% | 1073 / 1809 |
| kurrentdb | 16 | 51294 / 68651 | 0 | 16.68 | 66.65 | 84.41 | 675.8% / 697.3% | 2019 / 3180 |
| eventsourcingdb | 16 | 1446 / 1600 | 0 | 706.22 | 785.91 | 795.34 | 112.5% / 116.8% | 52 / 74 |
| fact | 16 | 6848 / 6997 | 0 | 149.29 | 162.53 | 166.72 | 692.1% / 701.9% | 600 / 926 |
| postgres-dcb-marten | 16 | 56247 / 57045 | 0 | 17.73 | 33.08 | 39.16 | 701.9% / 711.2% | 872 / 1335 |
performance:
  concurrency:
    writers:
    - 16
  duration_seconds: 15
  mode: write
  name: batch-64
  operations:
    write:
      append_condition: none
      batch_size: 64
      event_size_bytes: 256
  samples_per_second: 2
  stores:
  - dcbdb
  - umadb
  - kurrentdb
  - eventsourcingdb
  - fact
  - postgres-dcb-marten
  use_docker: true
  warmup_seconds: 2