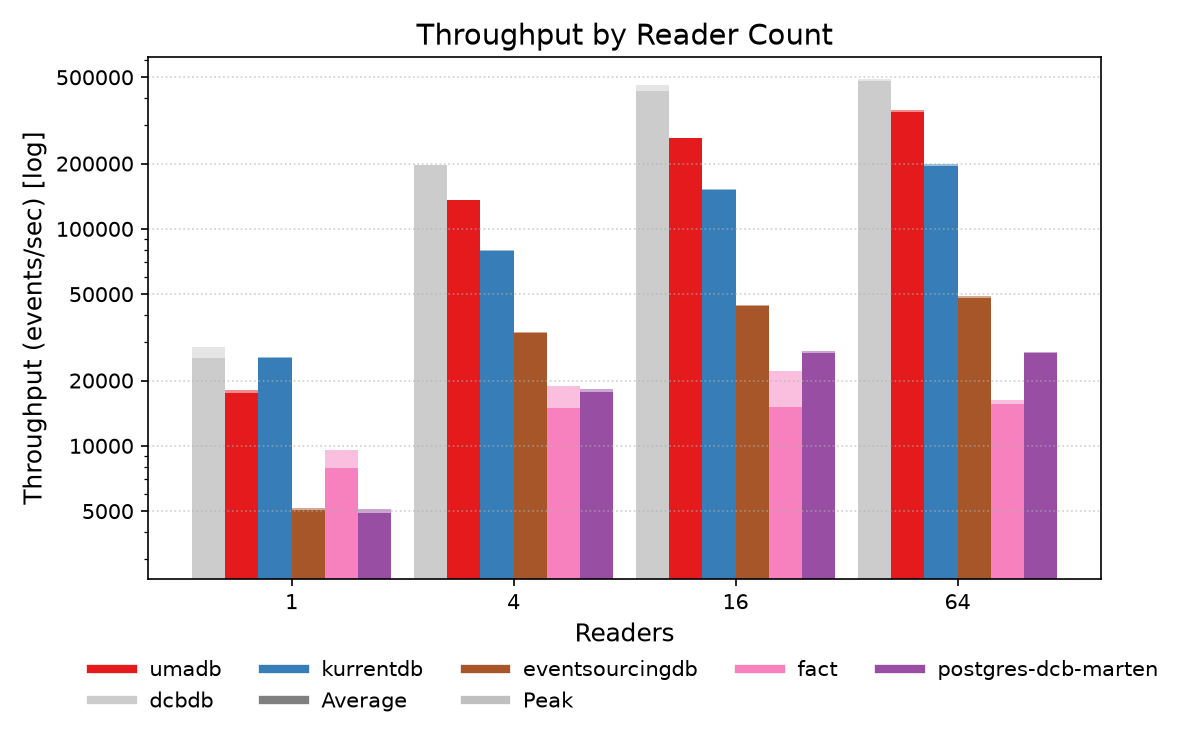
Throughput
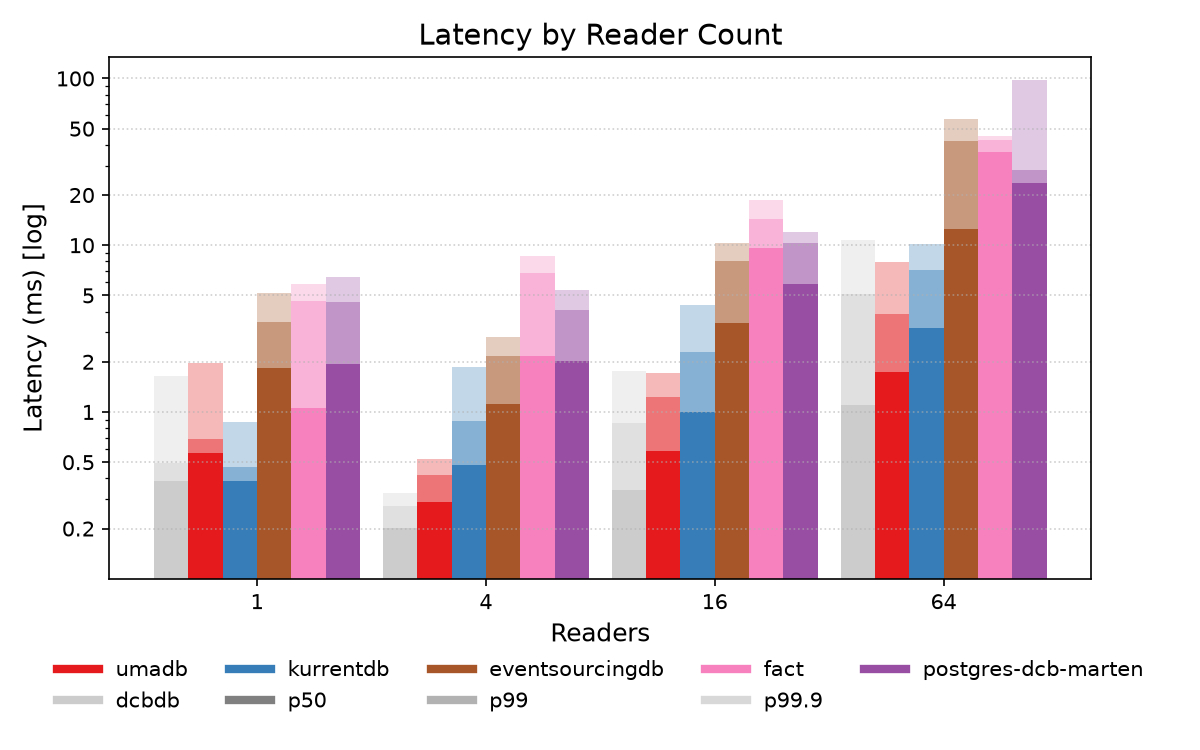
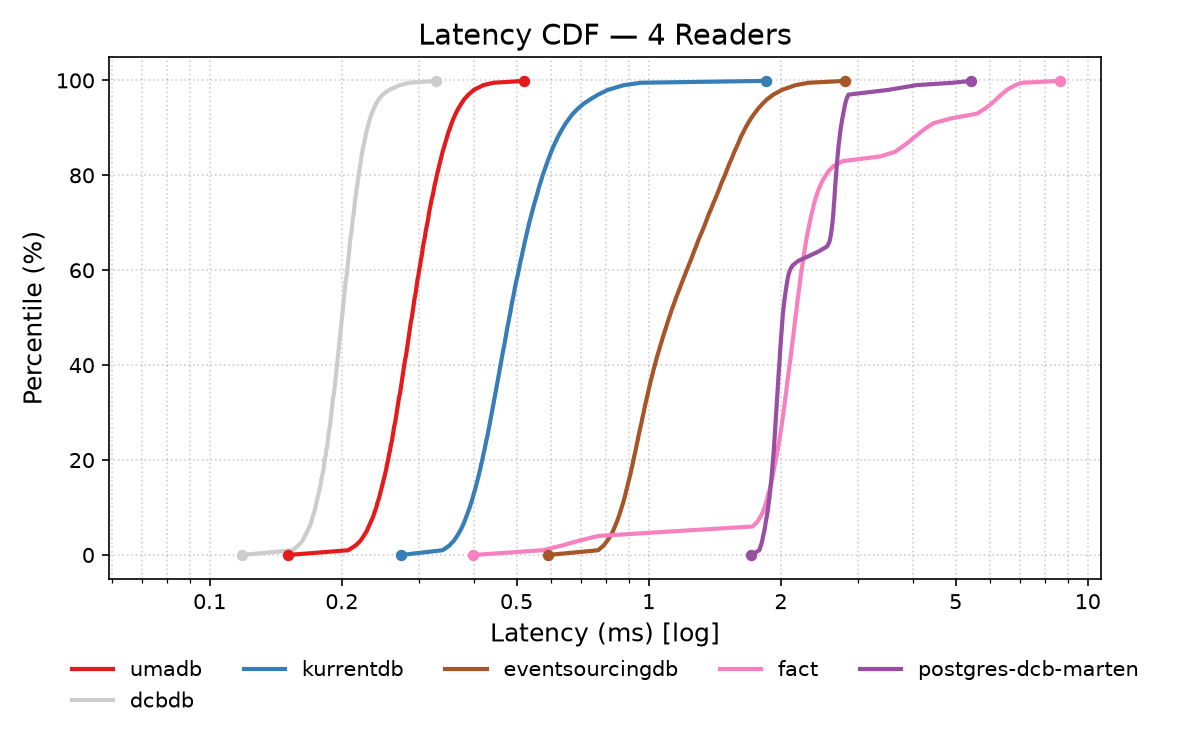
Latency
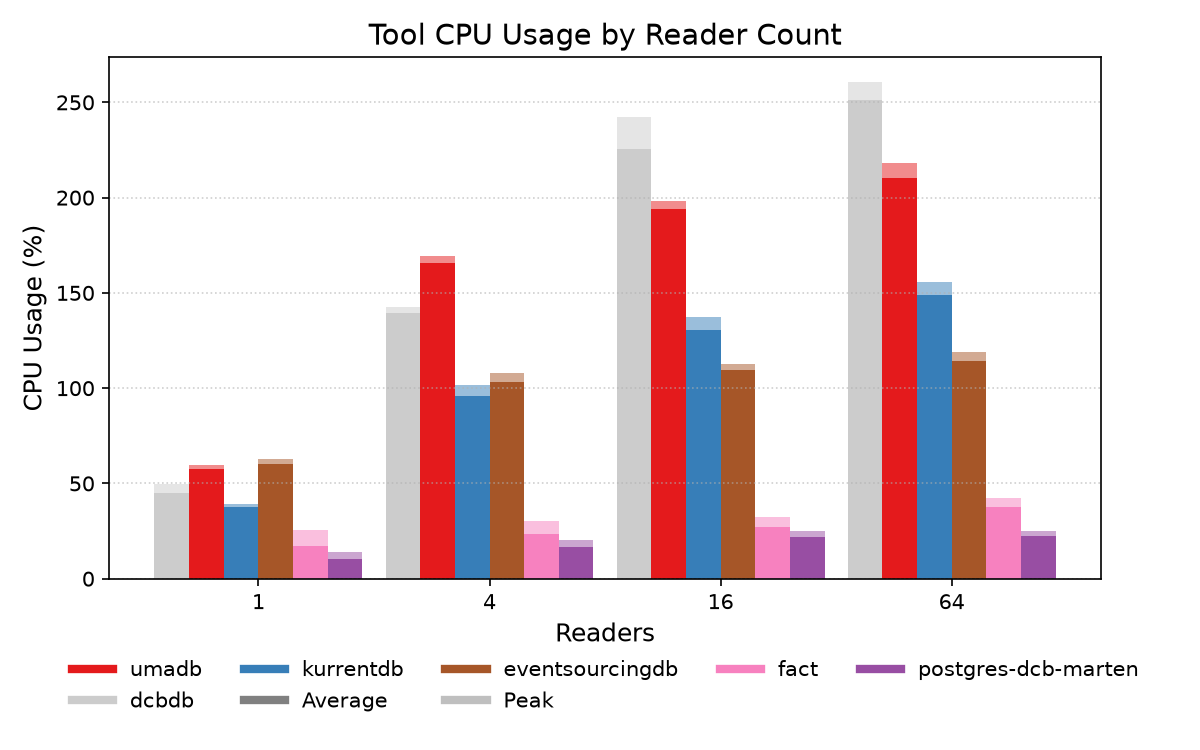
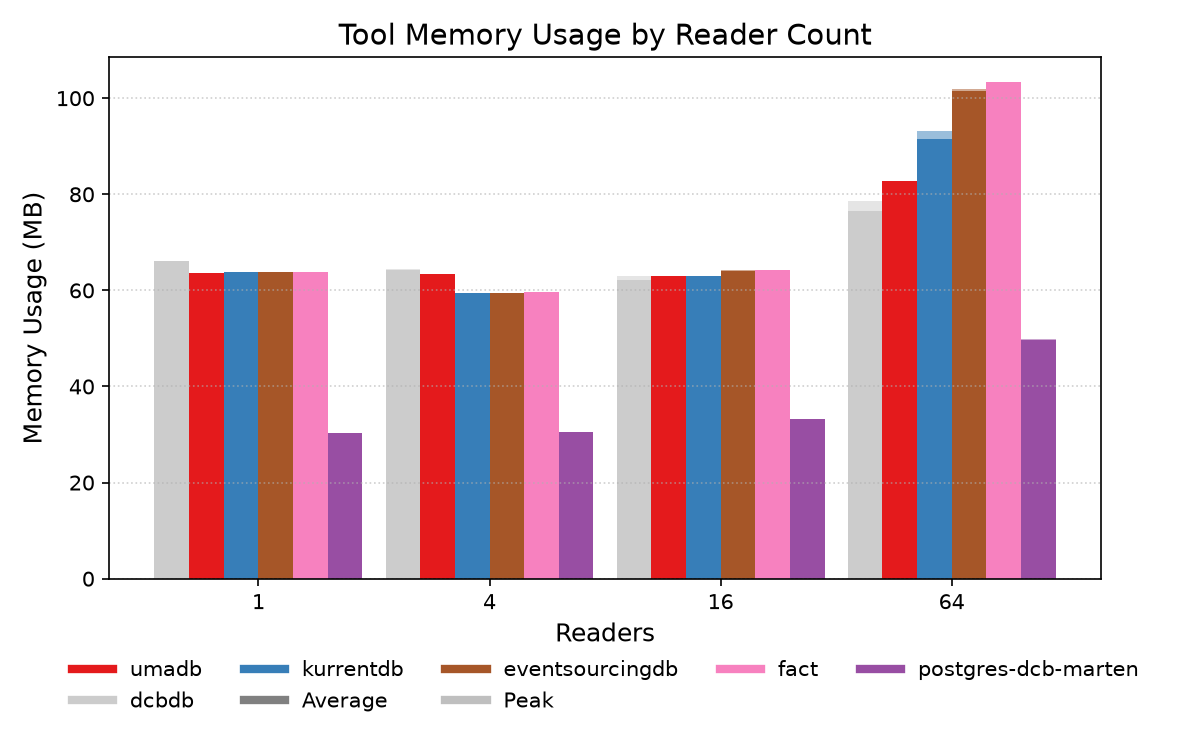
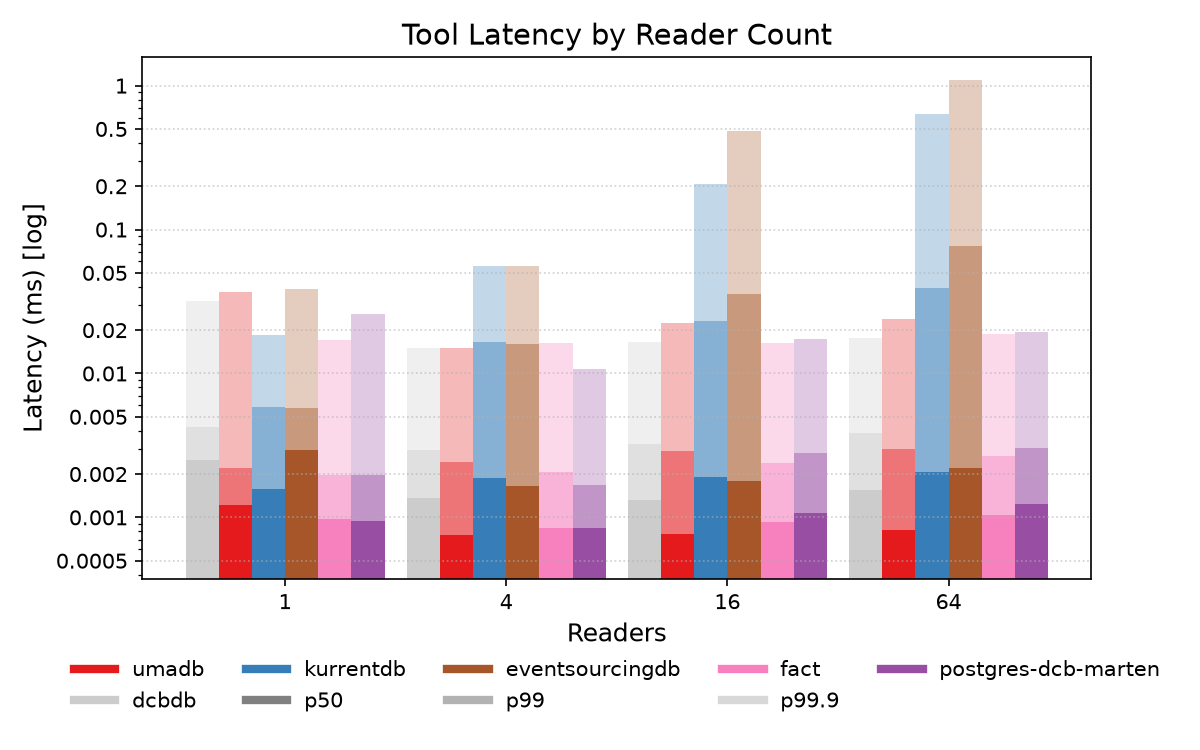
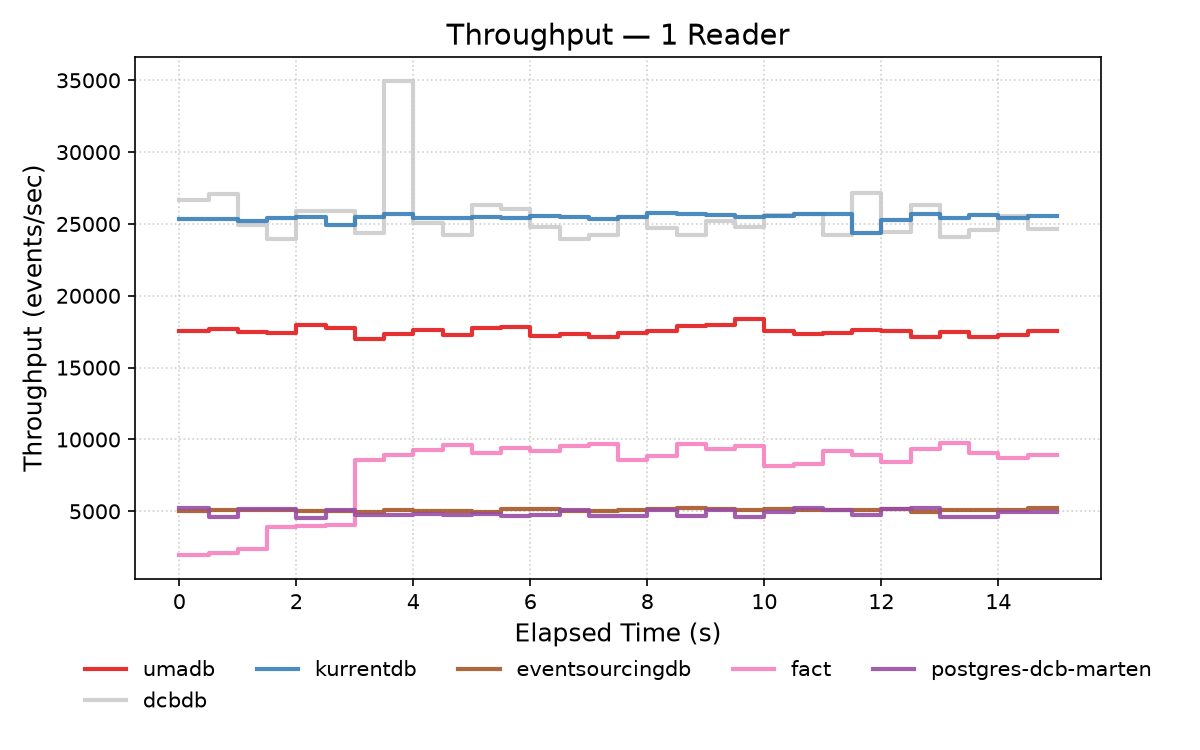
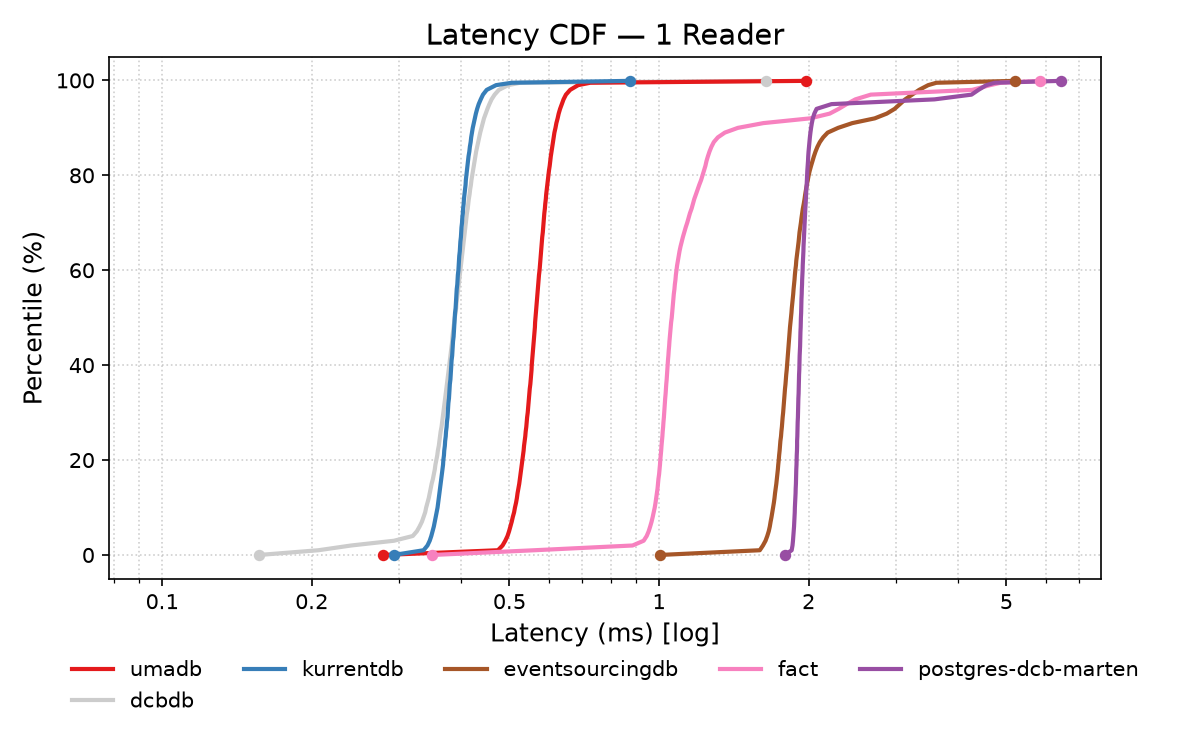
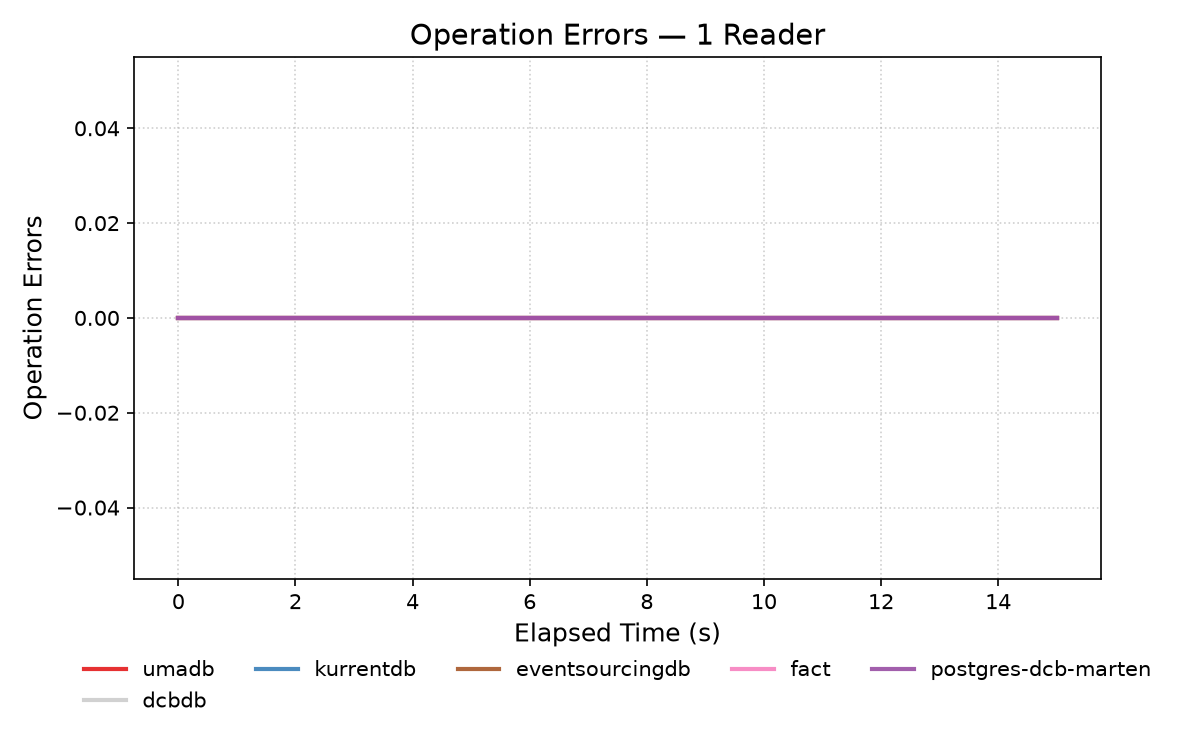
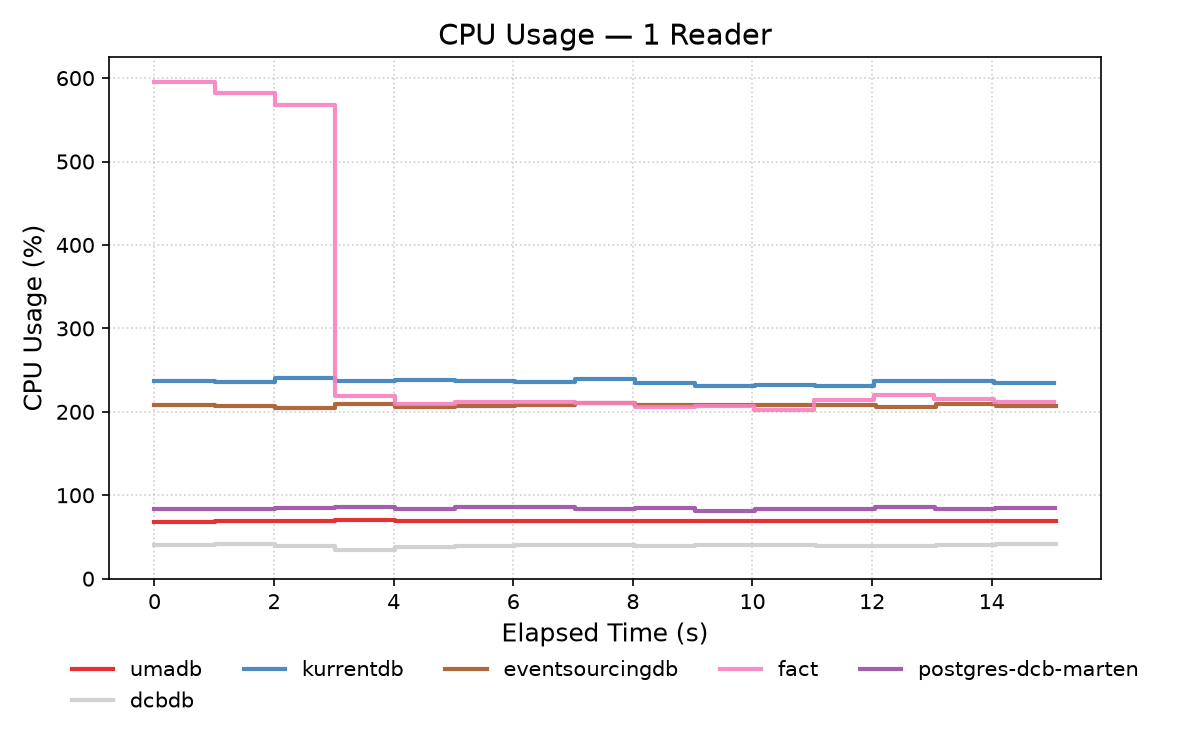
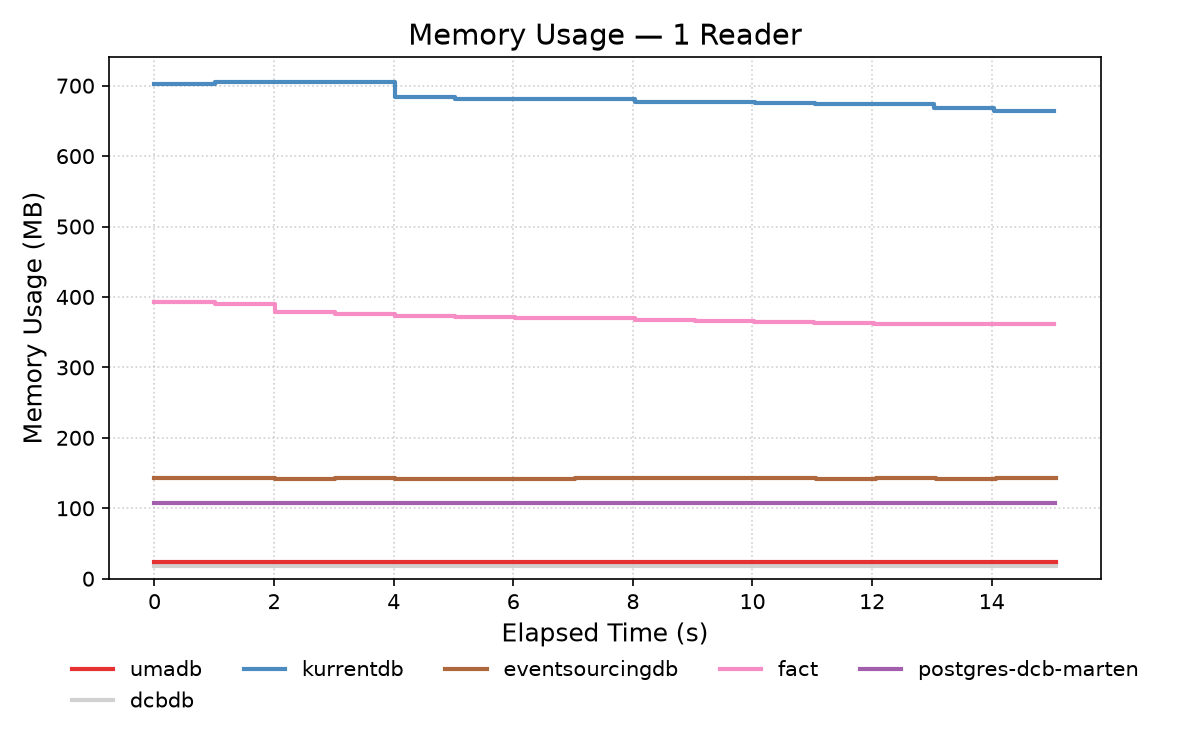
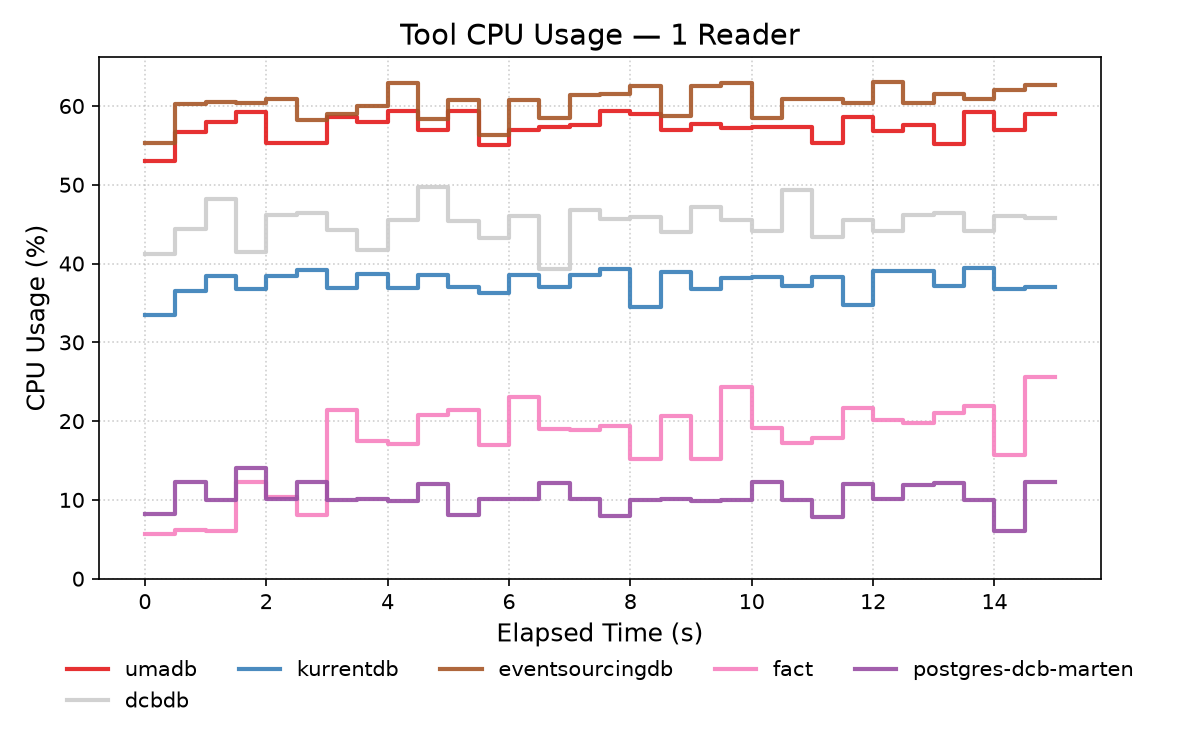
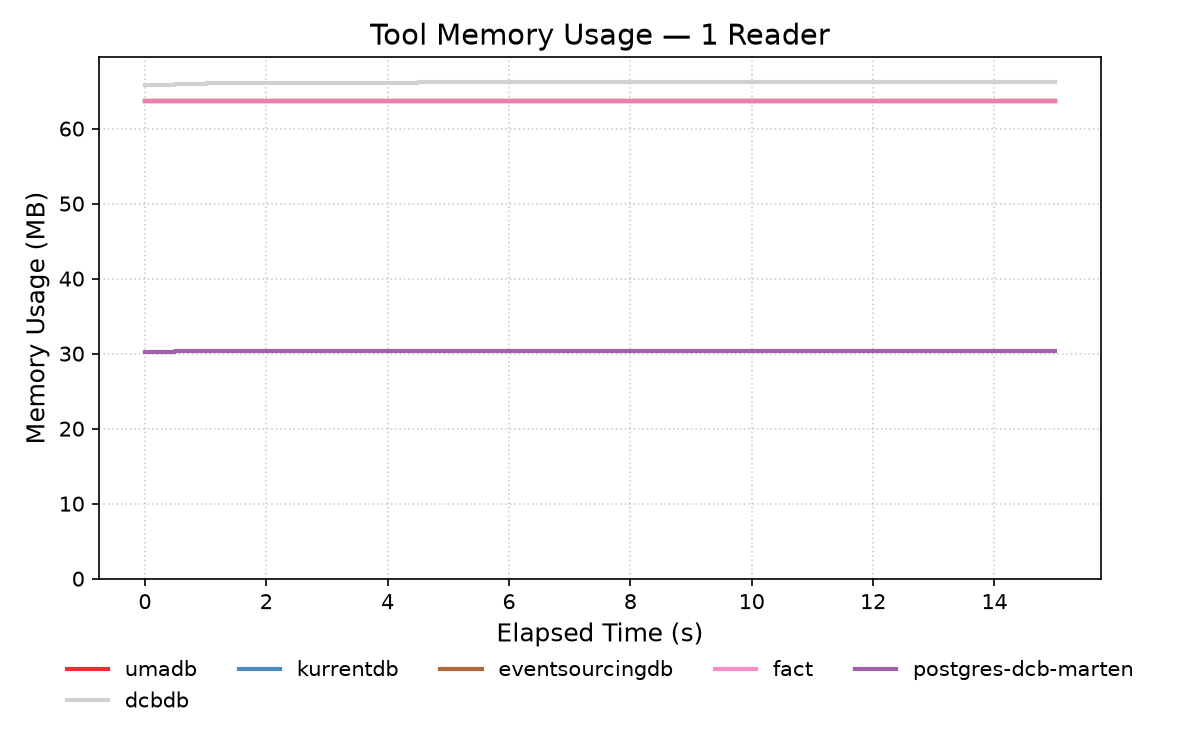
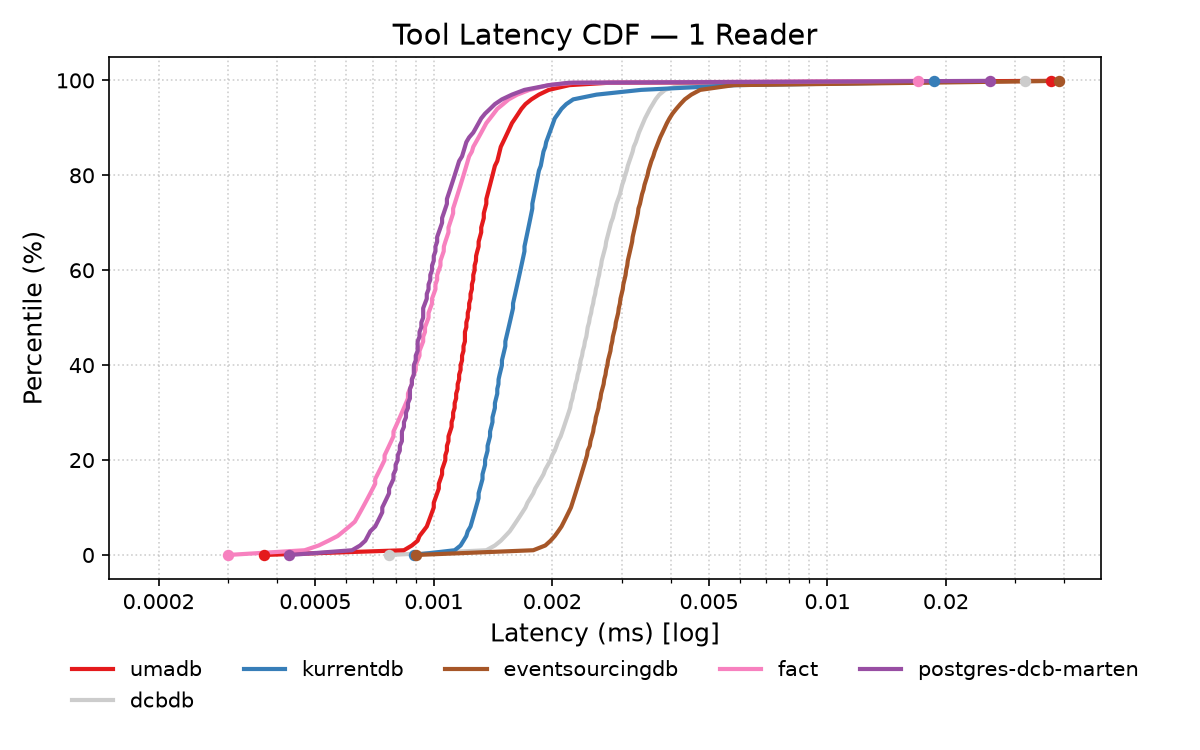
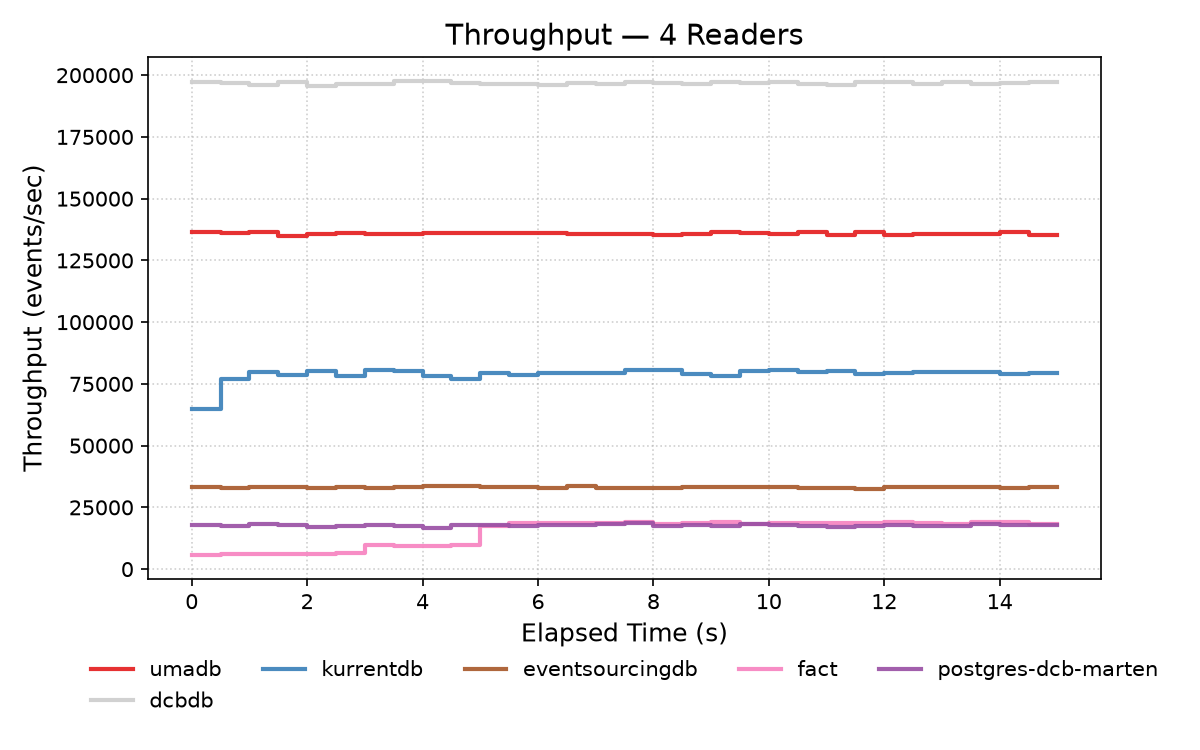
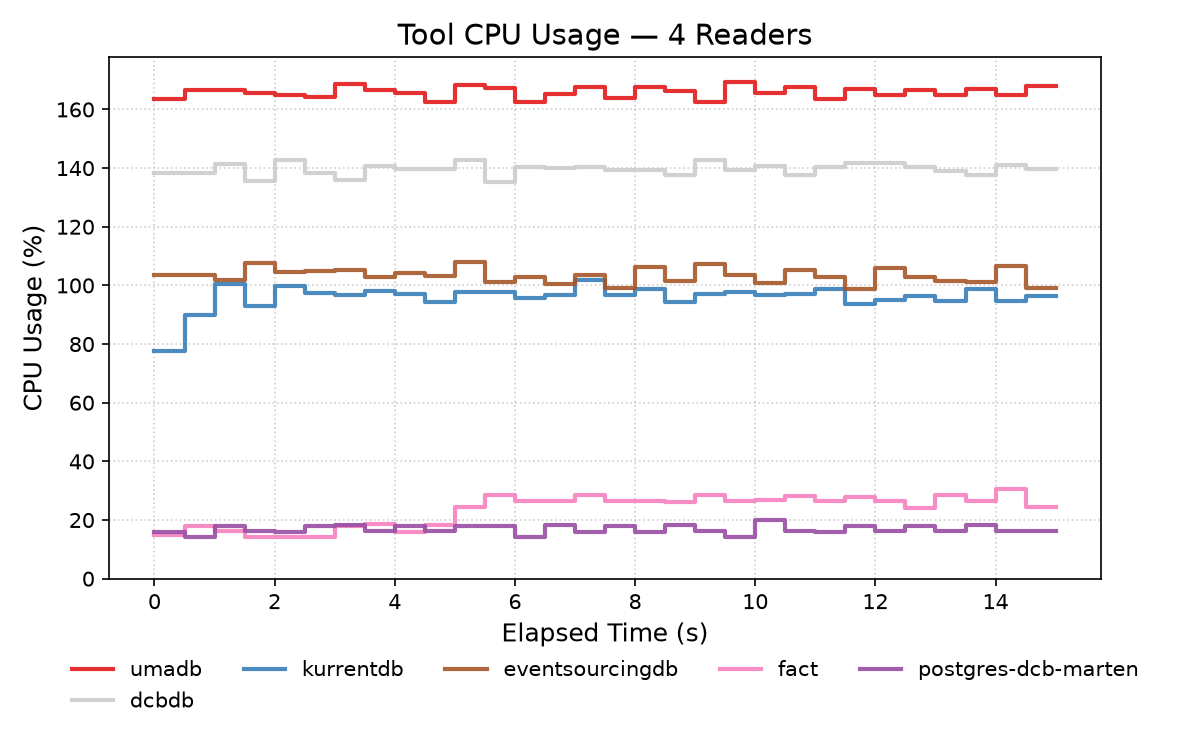
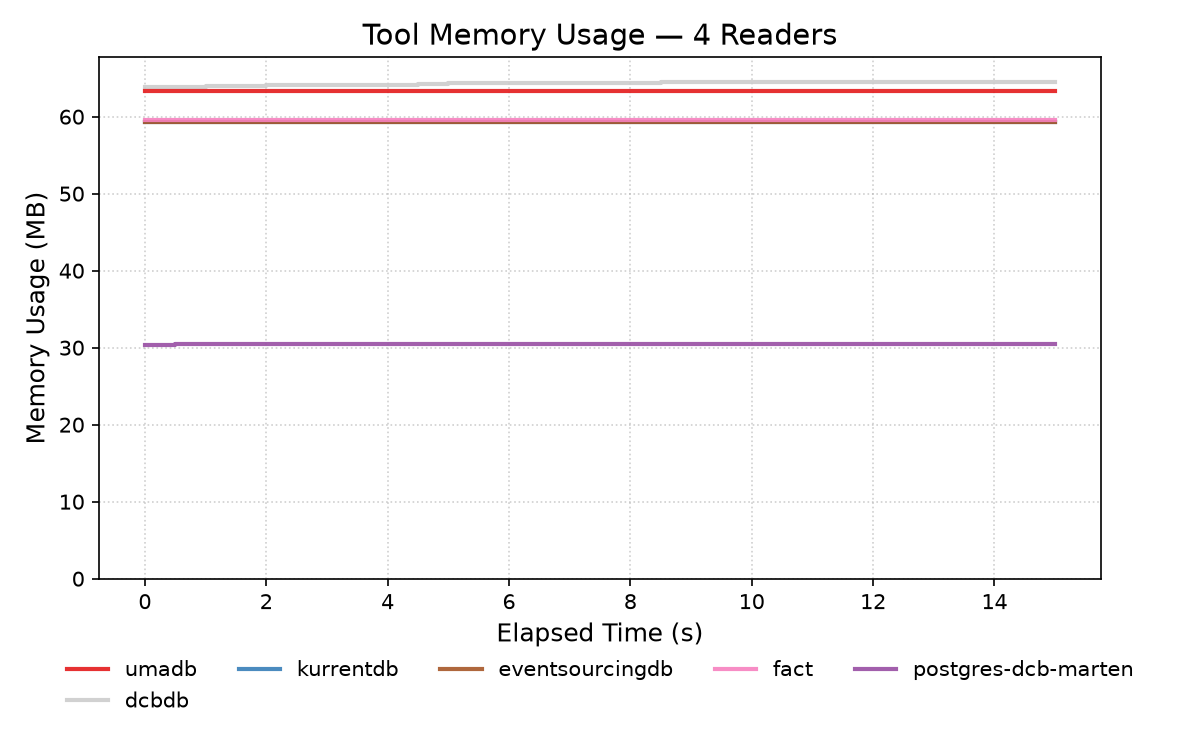
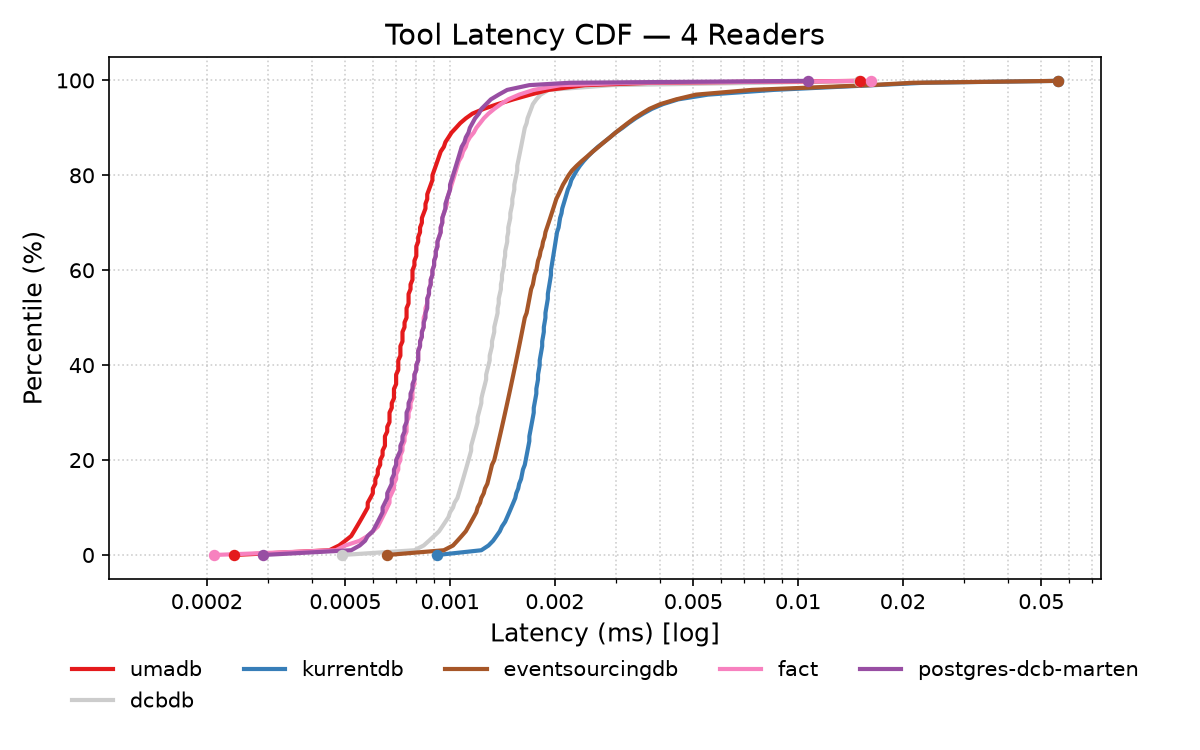
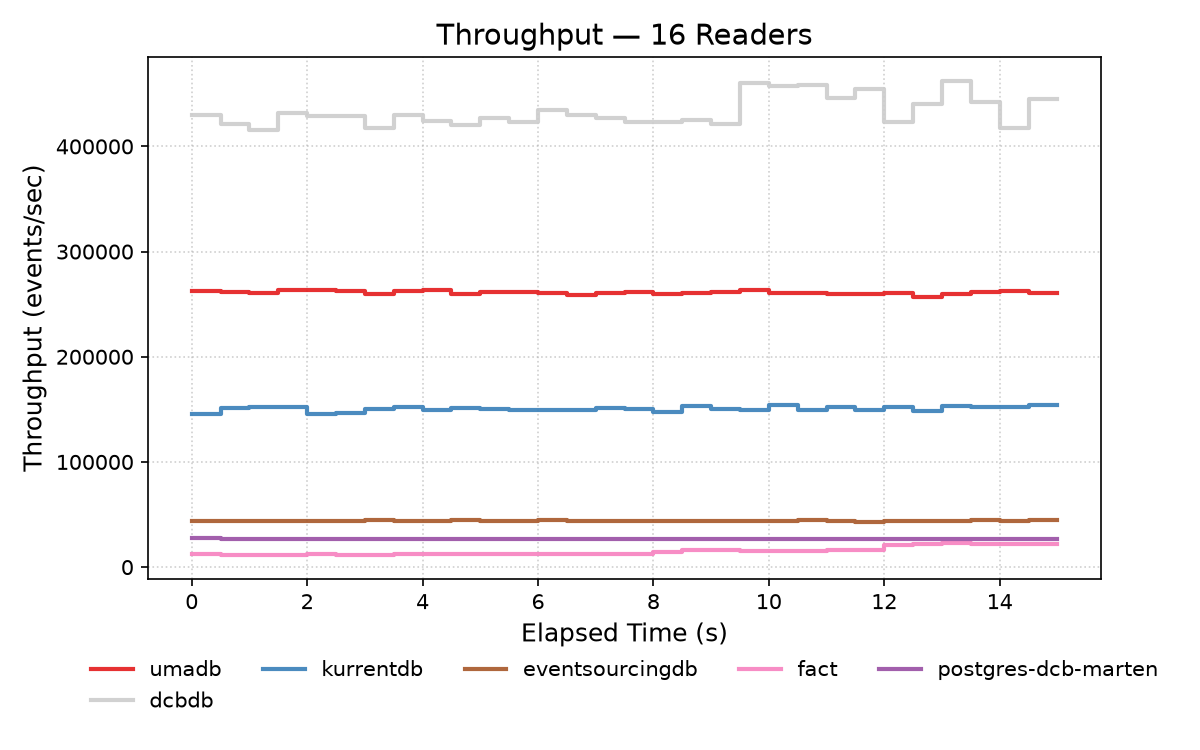
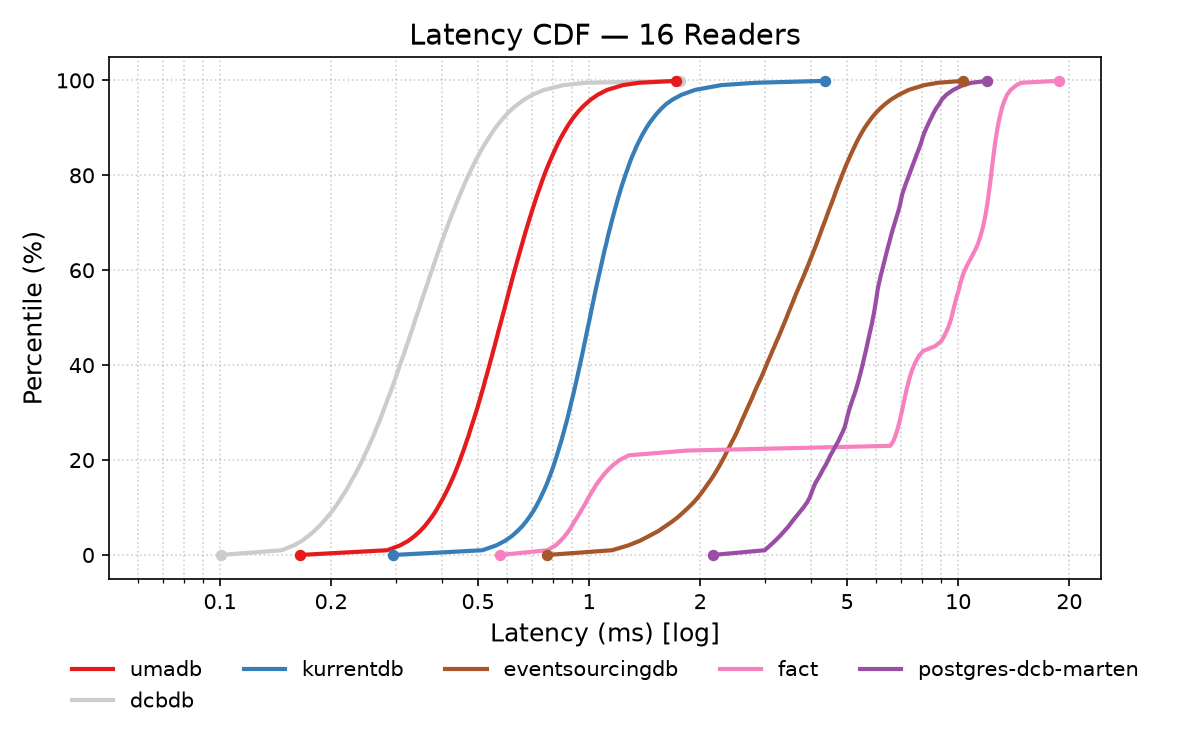
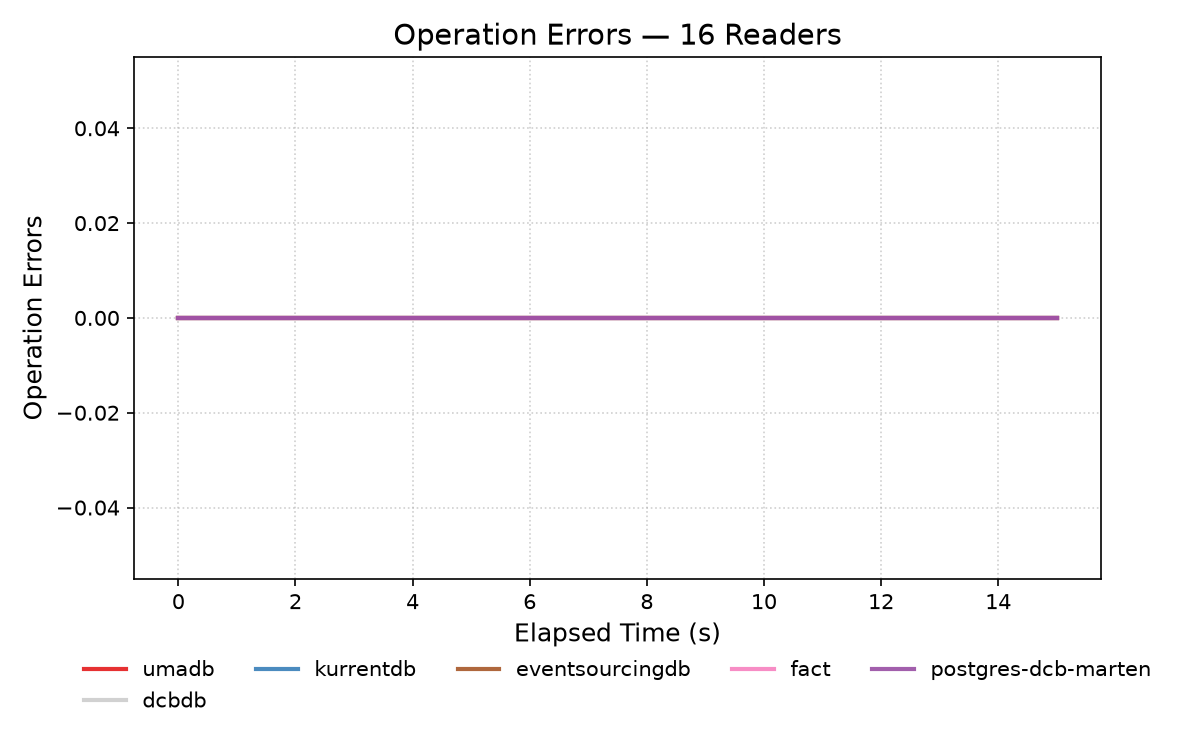
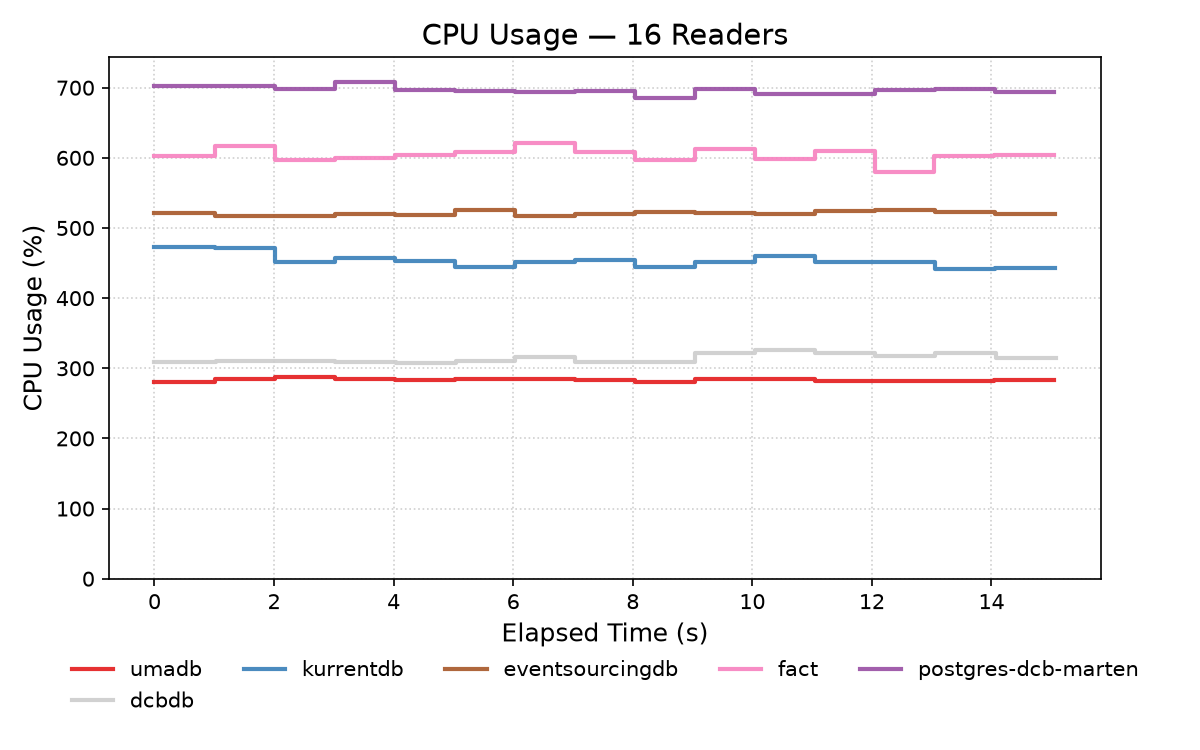
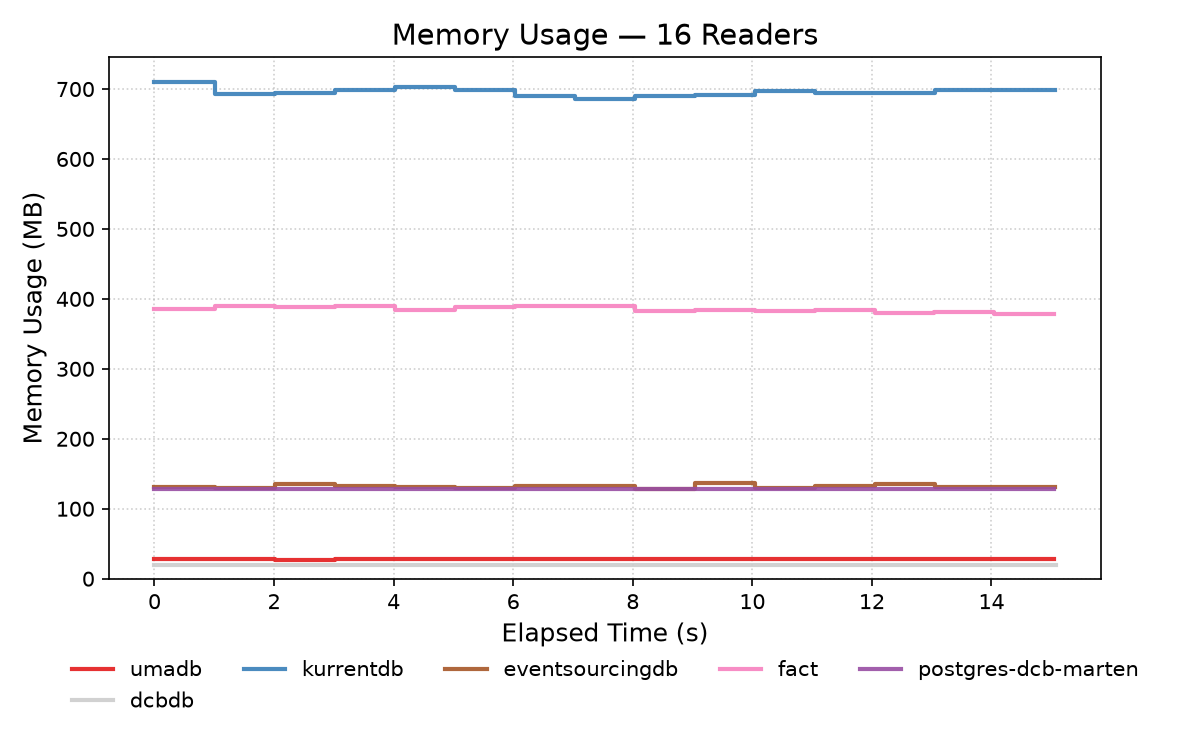
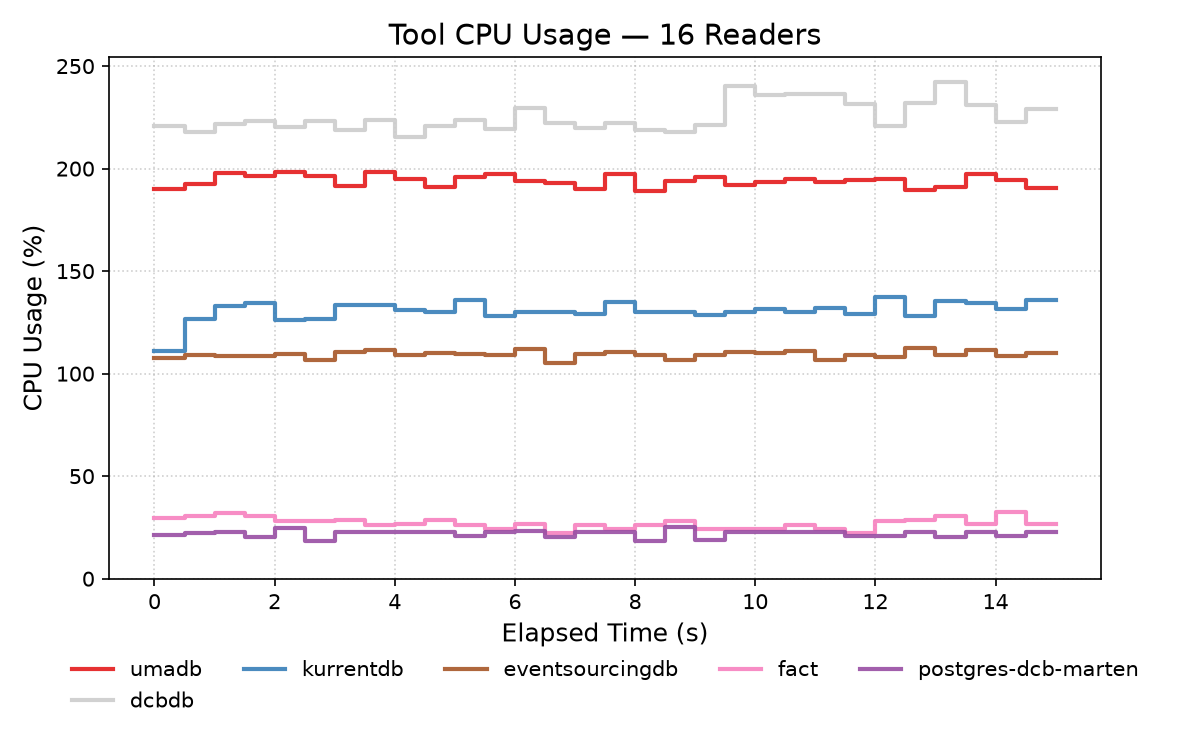
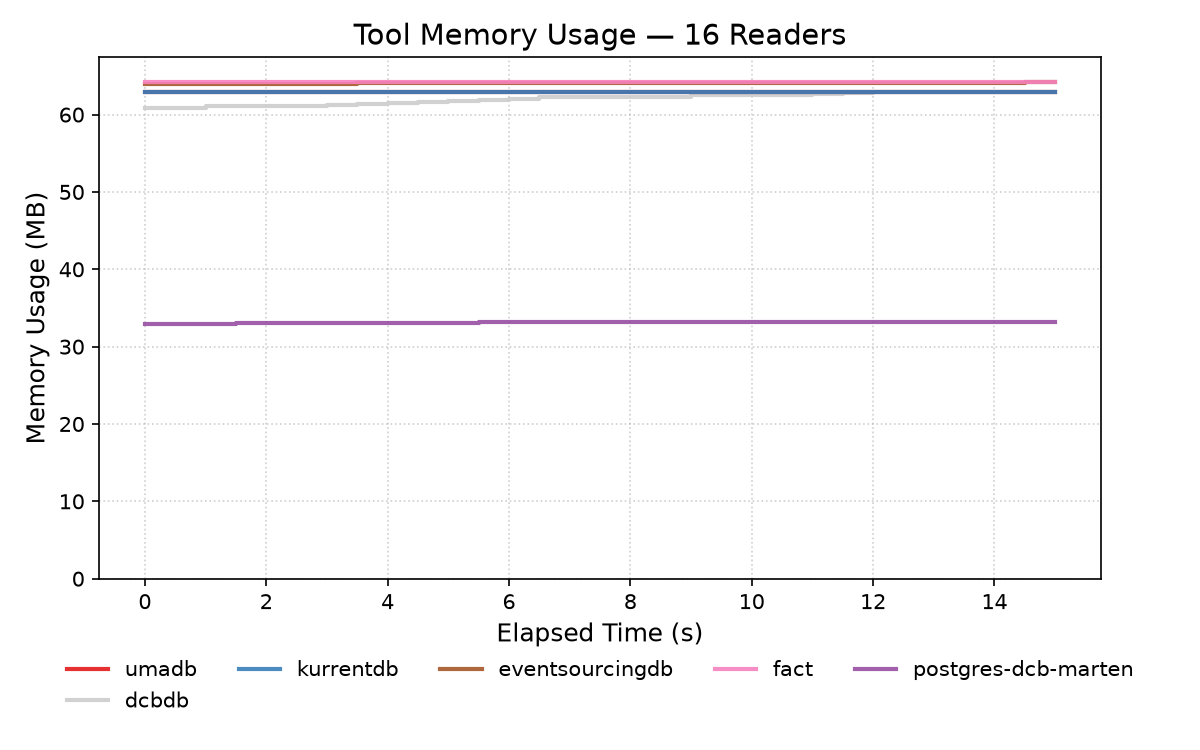
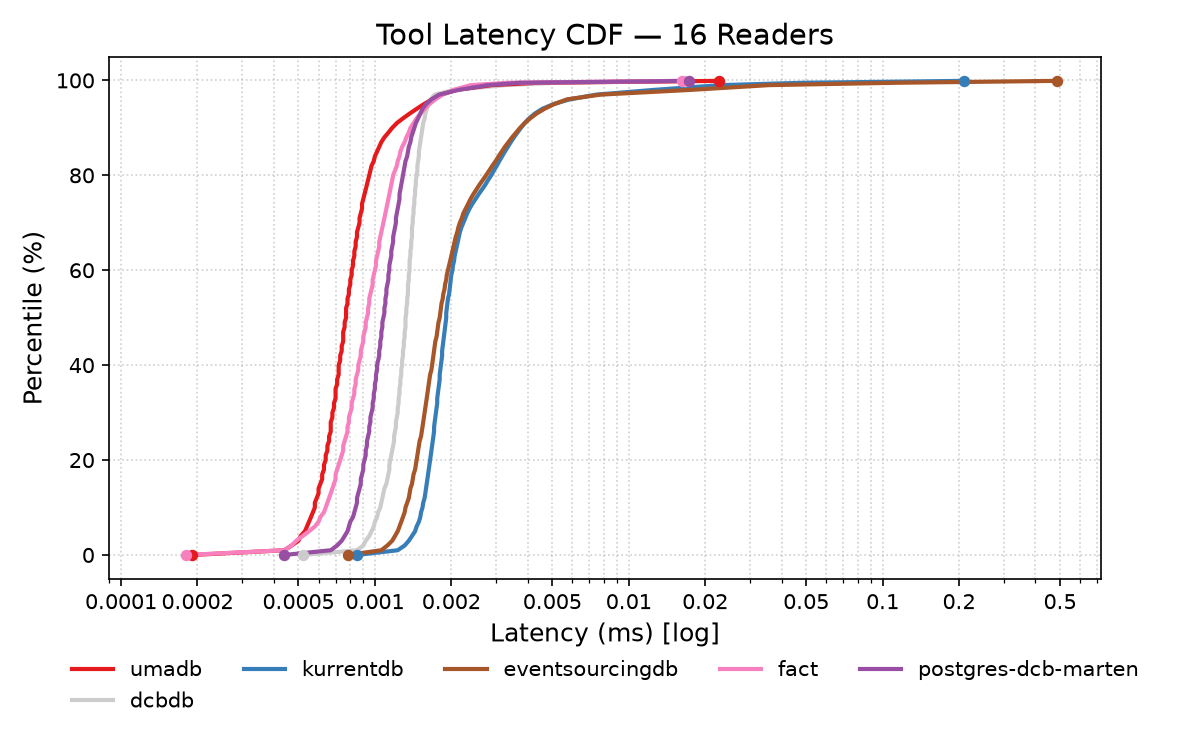
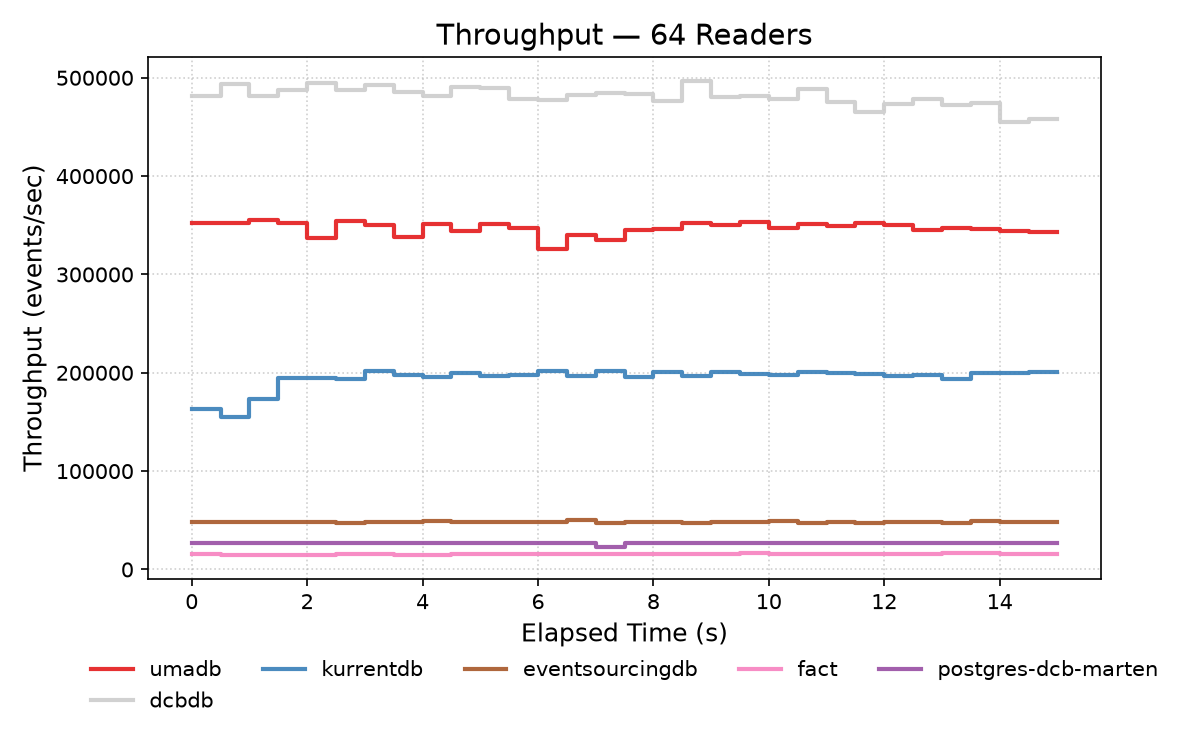
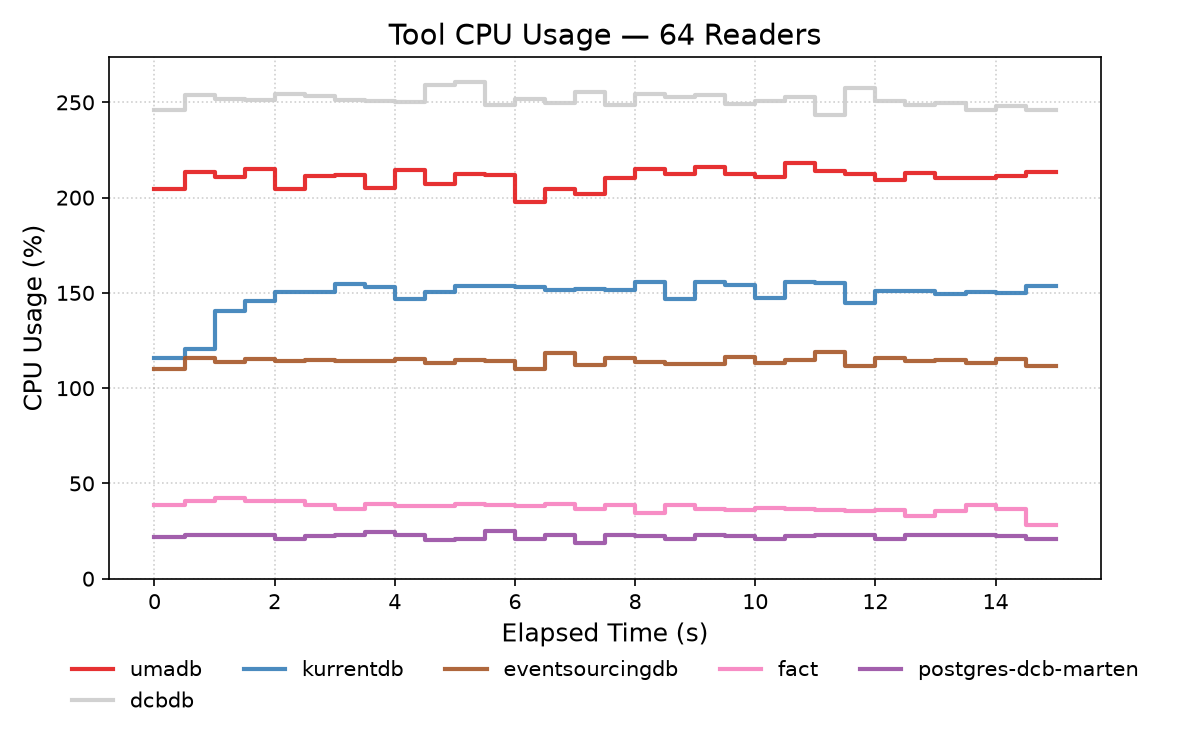
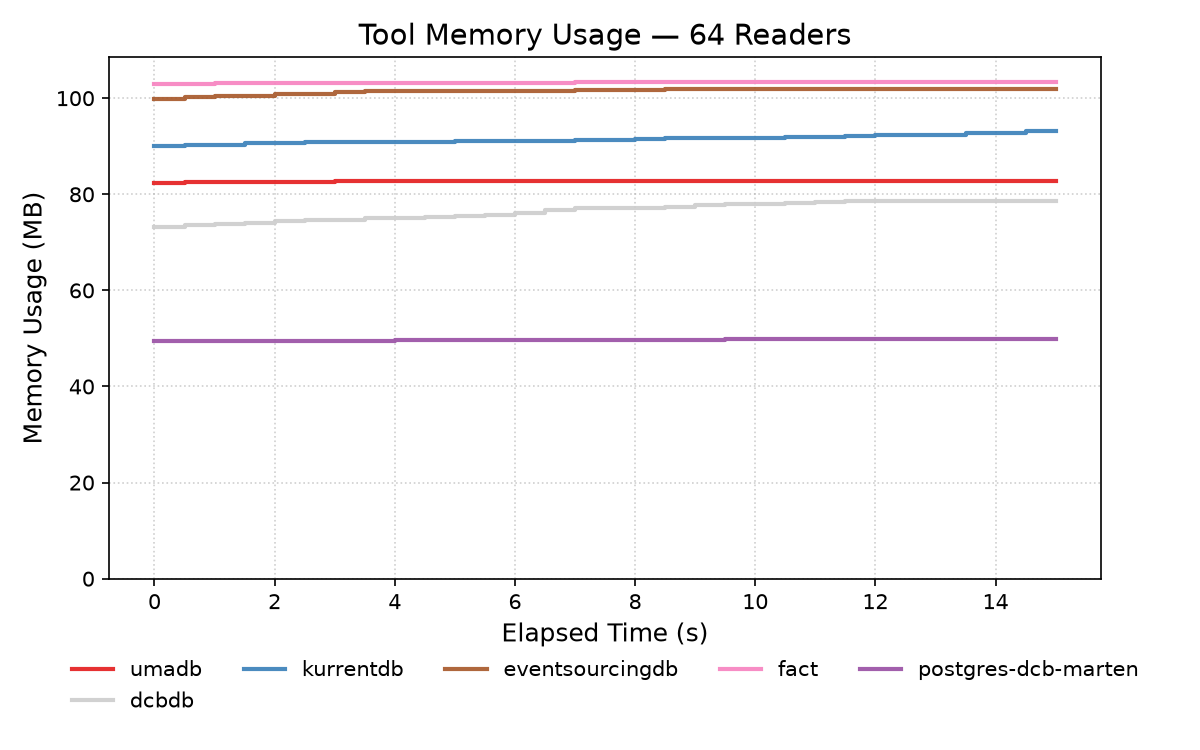
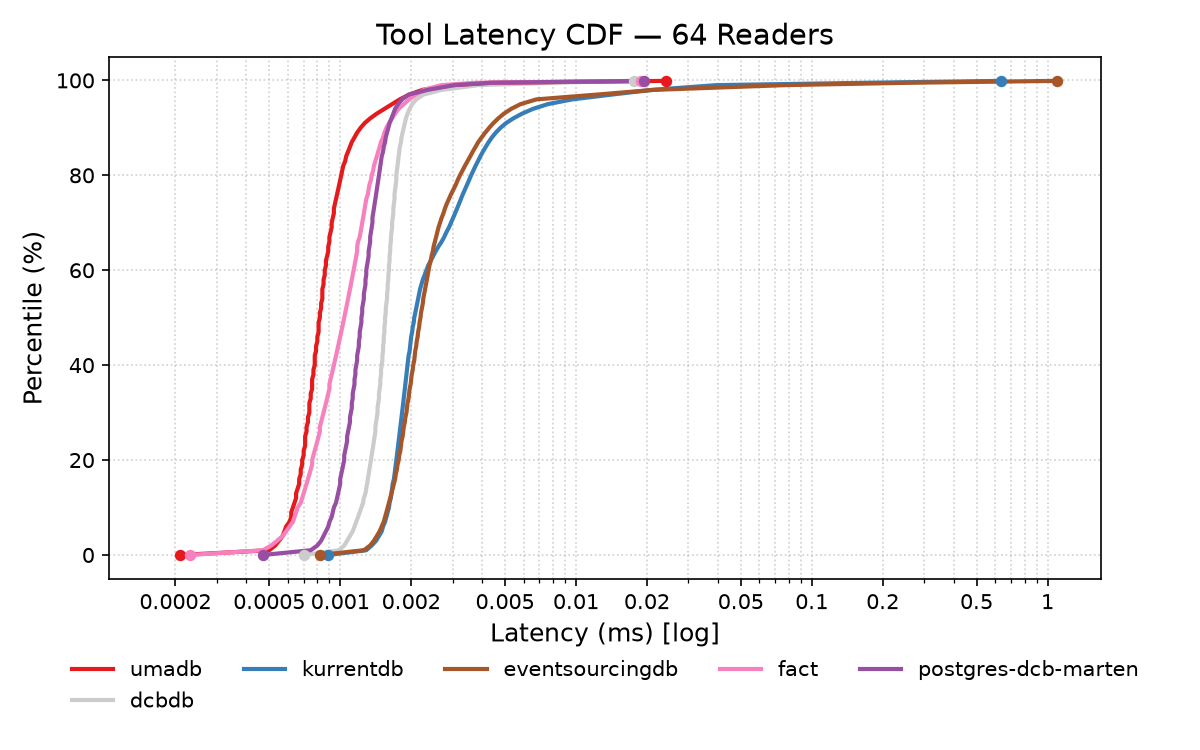
| Adapter | Readers | Throughput (eps) | Operation Errors | p50 (ms) | p99 (ms) | p99.9 (ms) | CPU (avg/peak) | Mem MB (avg/peak) |
|---|---|---|---|---|---|---|---|---|
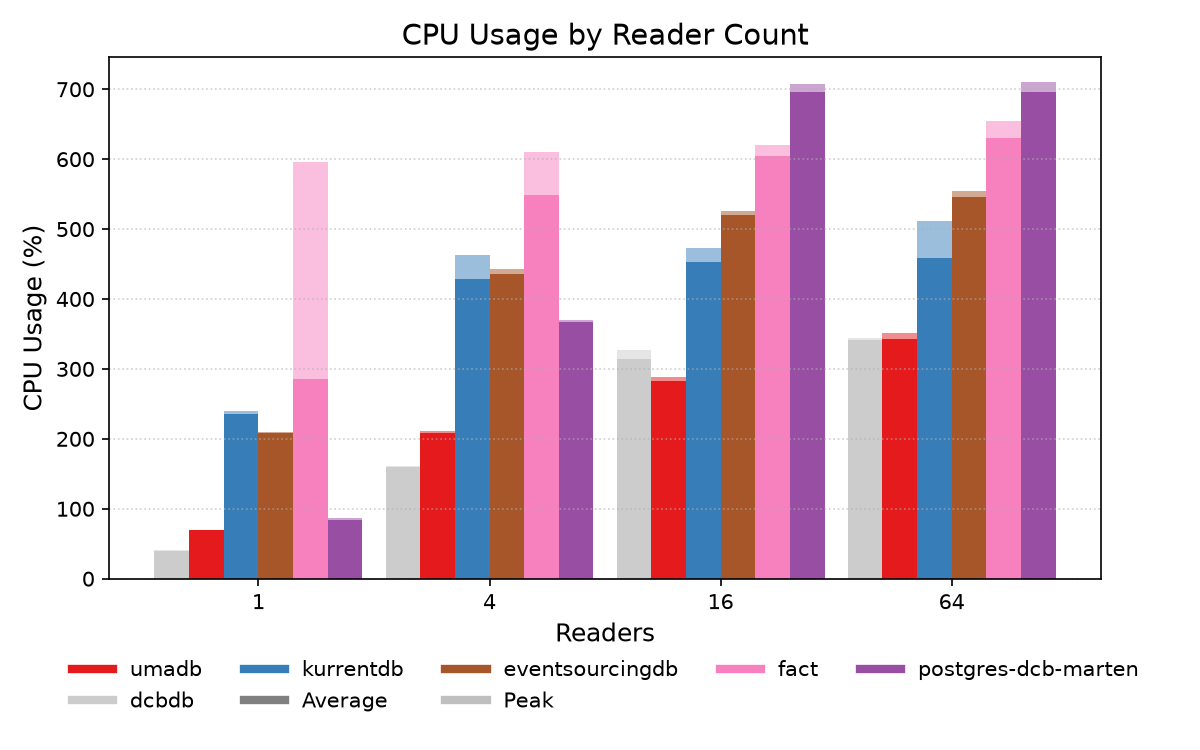
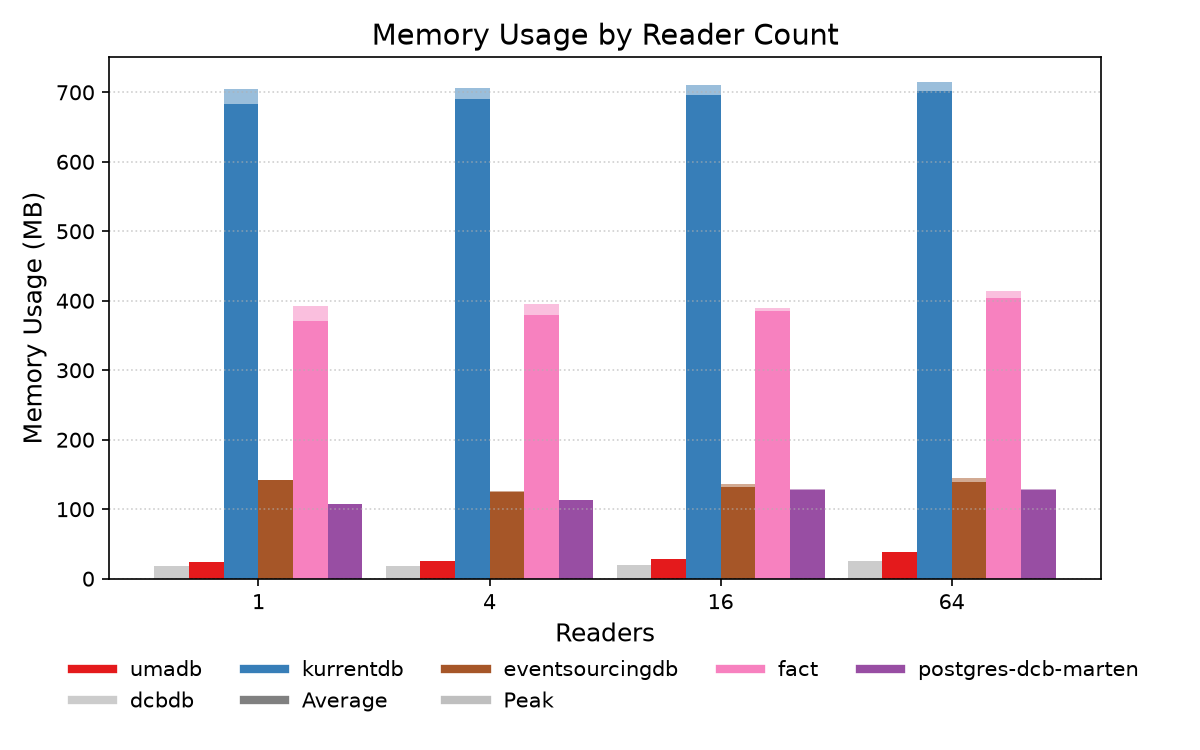
| dcbdb | 1 | 25505 / 28420 | 0 | 0.39 | 0.50 | 1.64 | 39.6% / 41.7% | 18 / 18 |
| umadb | 1 | 17519 / 18093 | 0 | 0.56 | 0.69 | 1.98 | 69.2% / 69.9% | 24 / 24 |
| kurrentdb | 1 | 25447 / 25707 | 0 | 0.39 | 0.47 | 0.87 | 235.9% / 240.3% | 684 / 705 |
| eventsourcingdb | 1 | 5081 / 5160 | 0 | 1.84 | 3.48 | 5.21 | 207.7% / 210.4% | 142 / 143 |
| fact | 1 | 7885 / 9520 | 0 | 1.06 | 4.64 | 5.86 | 285.6% / 595.3% | 371 / 392 |
| postgres-dcb-marten | 1 | 4882 / 5093 | 0 | 1.93 | 4.56 | 6.43 | 84.2% / 86.2% | 108 / 108 |
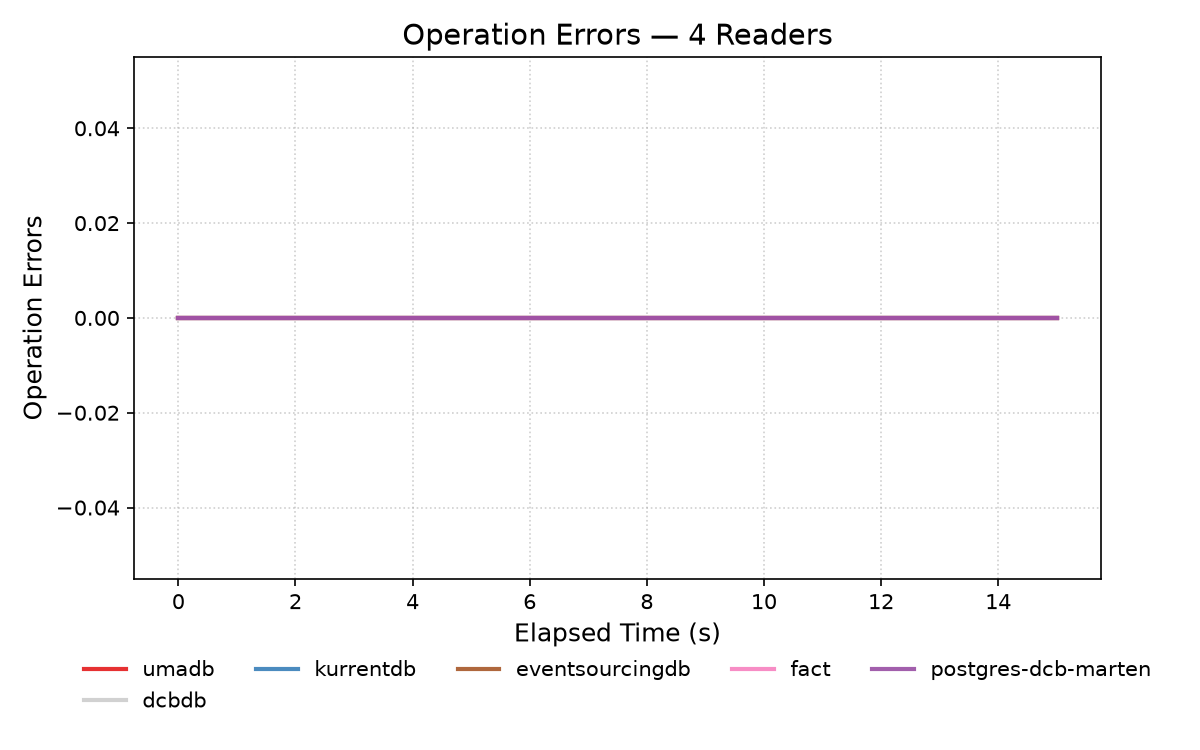
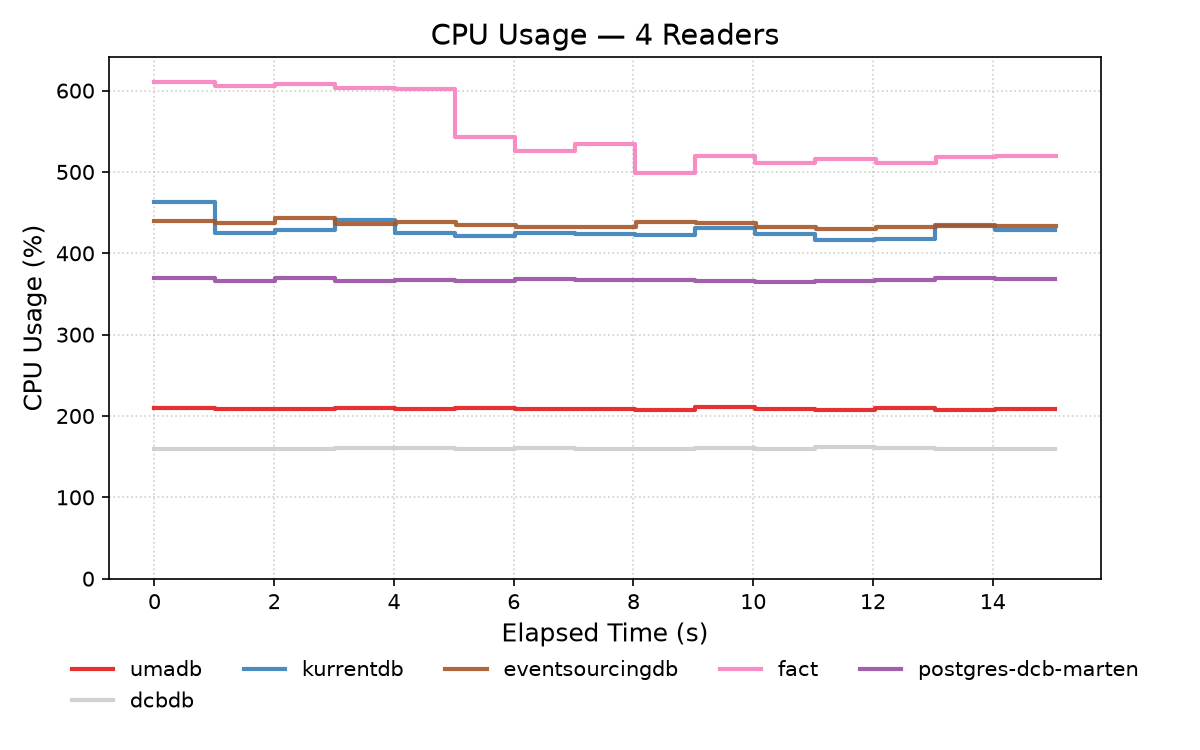
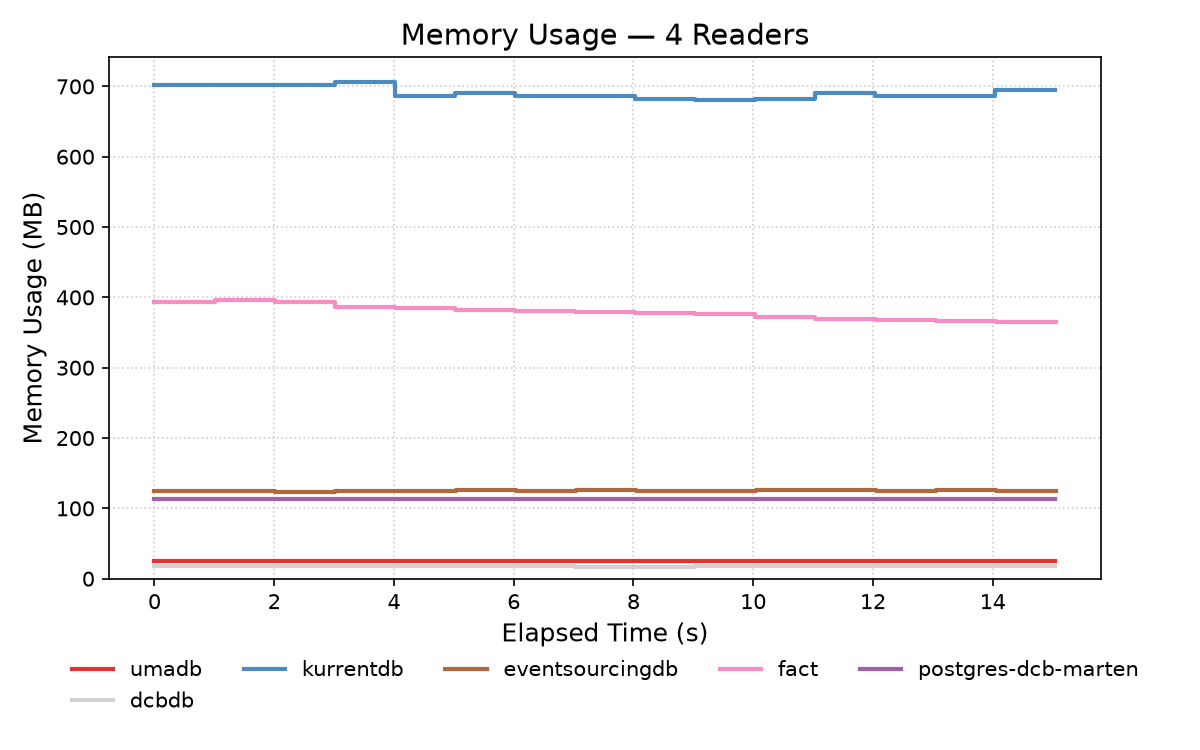
| dcbdb | 4 | 196764 / 197447 | 0 | 0.20 | 0.27 | 0.33 | 160.0% / 161.6% | 18 / 18 |
| umadb | 4 | 135864 / 136300 | 0 | 0.29 | 0.42 | 0.52 | 209.0% / 210.6% | 25 / 25 |
| kurrentdb | 4 | 78862 / 80273 | 0 | 0.48 | 0.88 | 1.85 | 428.6% / 463.4% | 691 / 706 |
| eventsourcingdb | 4 | 33120 / 33507 | 0 | 1.11 | 2.16 | 2.81 | 435.4% / 443.6% | 125 / 126 |
| fact | 4 | 14895 / 18853 | 0 | 2.16 | 6.83 | 8.63 | 548.6% / 610.6% | 379 / 396 |
| postgres-dcb-marten | 4 | 17707 / 18240 | 0 | 2.02 | 4.07 | 5.41 | 367.3% / 369.8% | 113 / 114 |
| dcbdb | 16 | 433017 / 458980 | 0 | 0.34 | 0.85 | 1.76 | 314.3% / 326.6% | 19 / 20 |
| umadb | 16 | 261077 / 263060 | 0 | 0.58 | 1.23 | 1.72 | 283.3% / 288.1% | 28 / 28 |
| kurrentdb | 16 | 150475 / 153310 | 0 | 1.01 | 2.28 | 4.36 | 453.3% / 473.5% | 696 / 710 |
| eventsourcingdb | 16 | 44031 / 44473 | 0 | 3.43 | 8.09 | 10.29 | 520.8% / 526.0% | 132 / 137 |
| fact | 16 | 15060 / 22207 | 0 | 9.58 | 14.39 | 18.73 | 604.2% / 620.5% | 385 / 390 |
| postgres-dcb-marten | 16 | 26831 / 27250 | 0 | 5.88 | 10.30 | 12.00 | 696.4% / 708.2% | 128 / 129 |
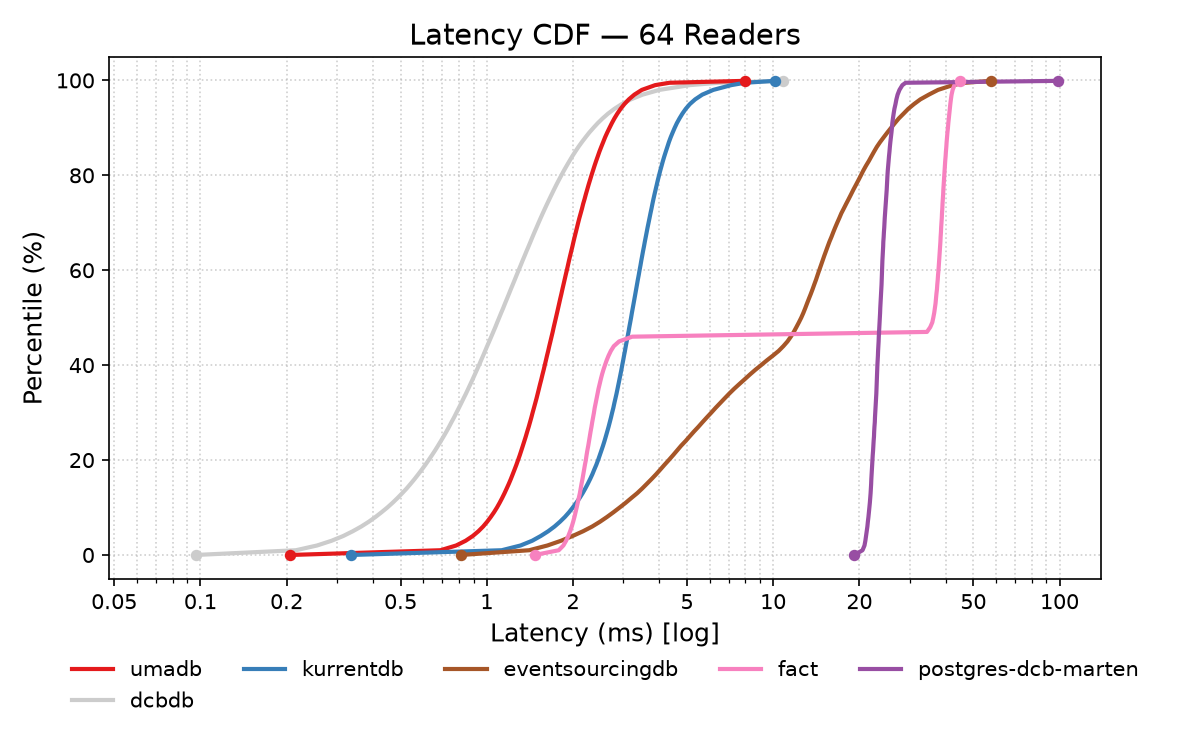
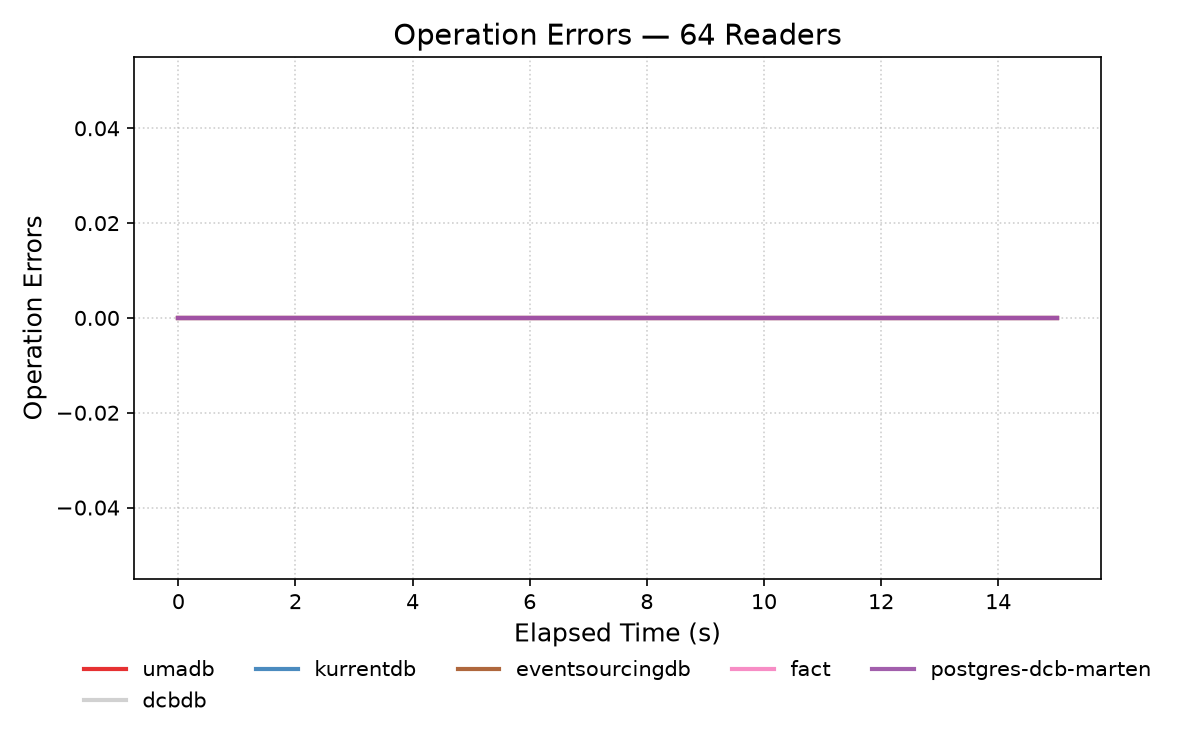
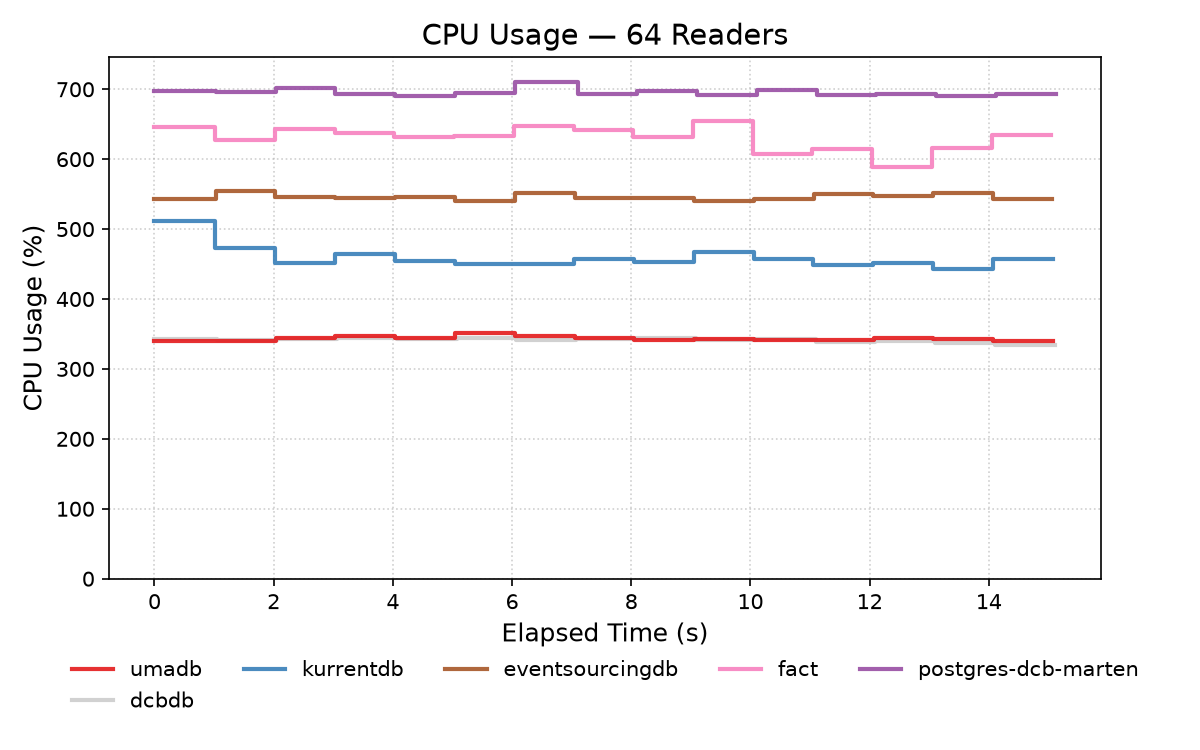
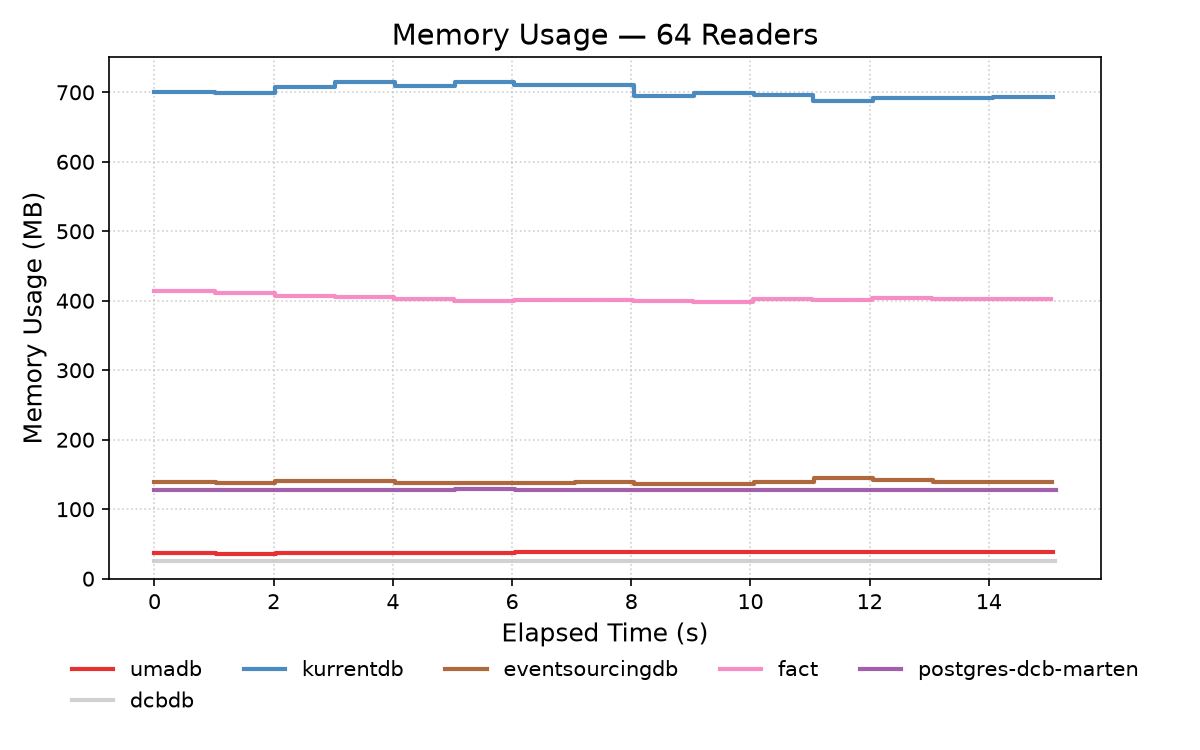
| dcbdb | 64 | 480816 / 491413 | 0 | 1.10 | 5.12 | 10.80 | 341.6% / 344.9% | 26 / 26 |
| umadb | 64 | 346893 / 353333 | 0 | 1.74 | 3.87 | 7.95 | 343.4% / 351.0% | 38 / 39 |
| kurrentdb | 64 | 194731 / 200100 | 0 | 3.19 | 7.14 | 10.12 | 459.3% / 511.9% | 701 / 715 |
| eventsourcingdb | 64 | 48275 / 48933 | 0 | 12.53 | 42.37 | 57.48 | 546.3% / 554.0% | 139 / 145 |
| fact | 64 | 15591 / 16213 | 0 | 36.24 | 42.96 | 45.06 | 630.5% / 655.3% | 404 / 414 |
| postgres-dcb-marten | 64 | 26869 / 27167 | 0 | 23.58 | 28.26 | 98.44 | 695.4% / 710.4% | 128 / 128 |
performance:
  concurrency:
    readers:
    - 1
    - 4
    - 16
    - 64
  duration_seconds: 15
  mode: read
  name: scale-read
  operations:
    read:
      dcb_query: one_tag_one_type
      limit: 100
    write:
      event_size_bytes: 256
  samples_per_second: 2
  setup:
    prepopulate_events: 20000
    prepopulate_streams: 2000
  stores:
  - dcbdb
  - umadb
  - kurrentdb
  - eventsourcingdb
  - fact
  - postgres-dcb-marten
  use_docker: true
  warmup_seconds: 2