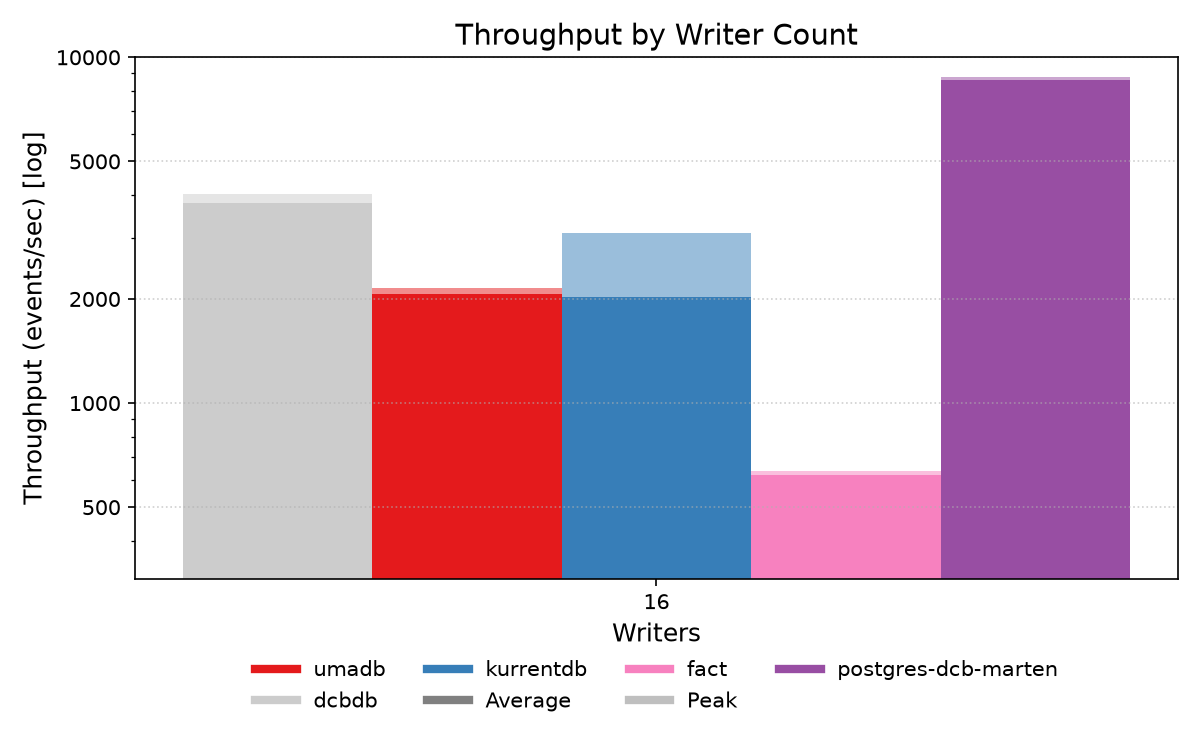
Throughput
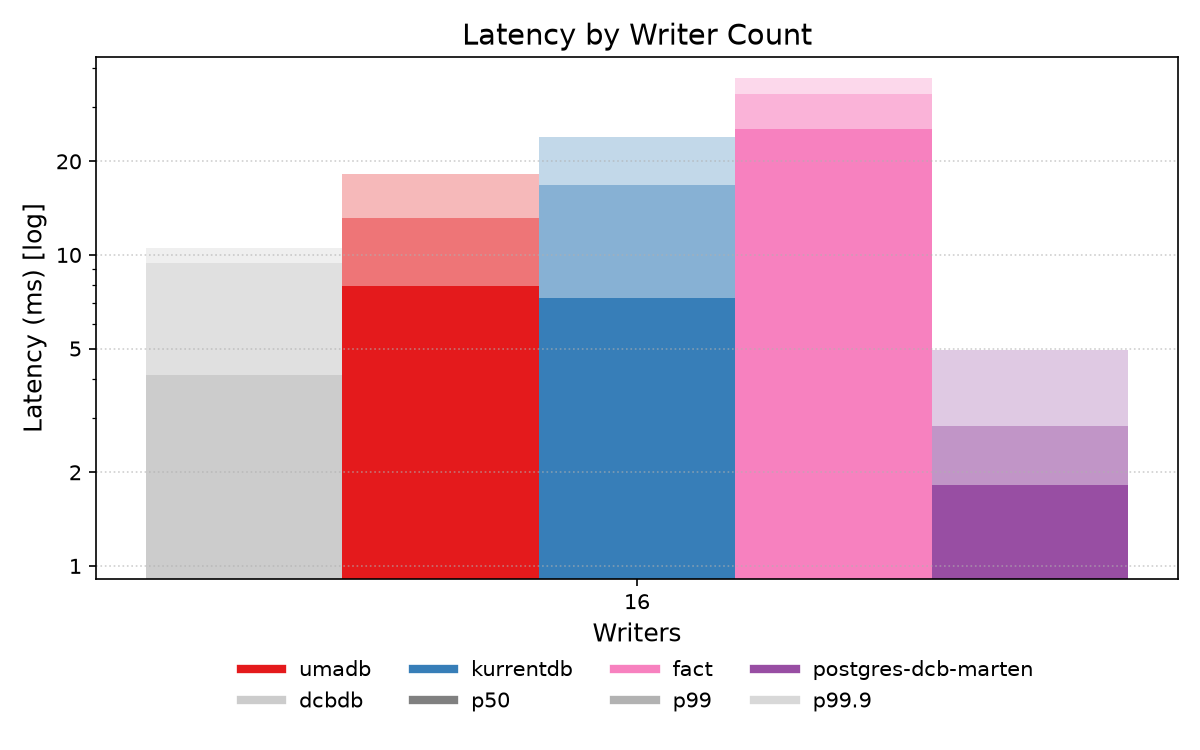
Latency
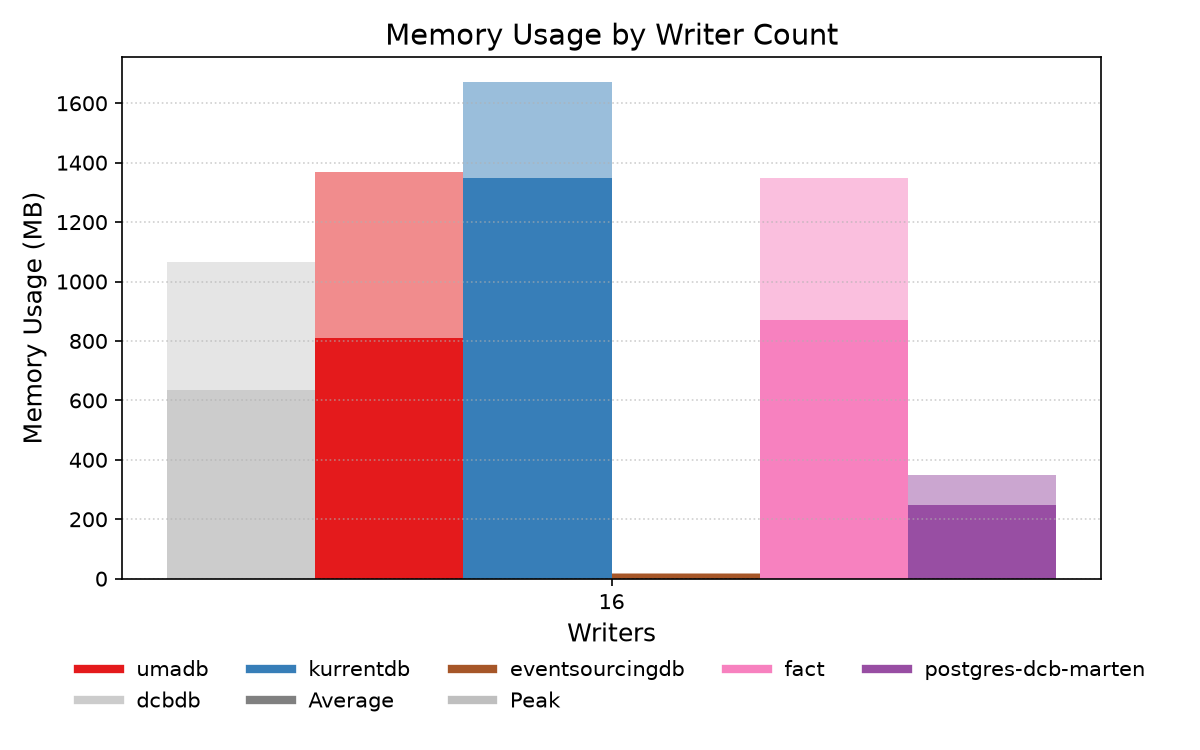
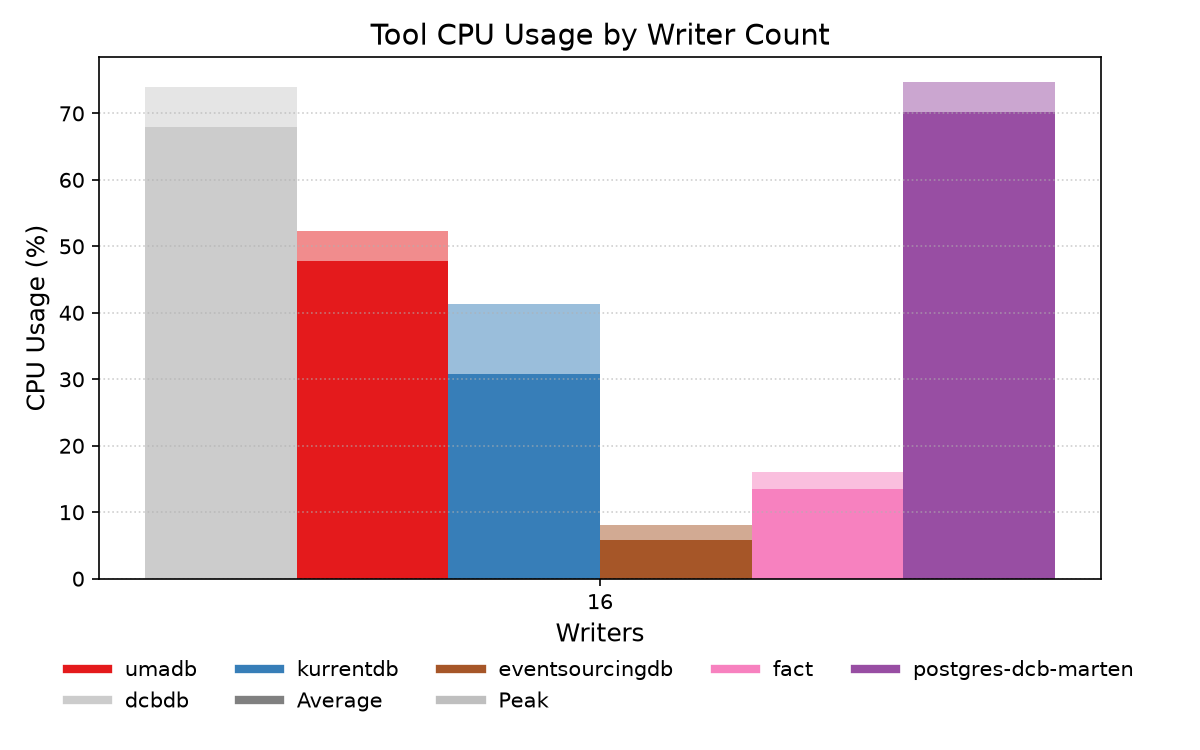
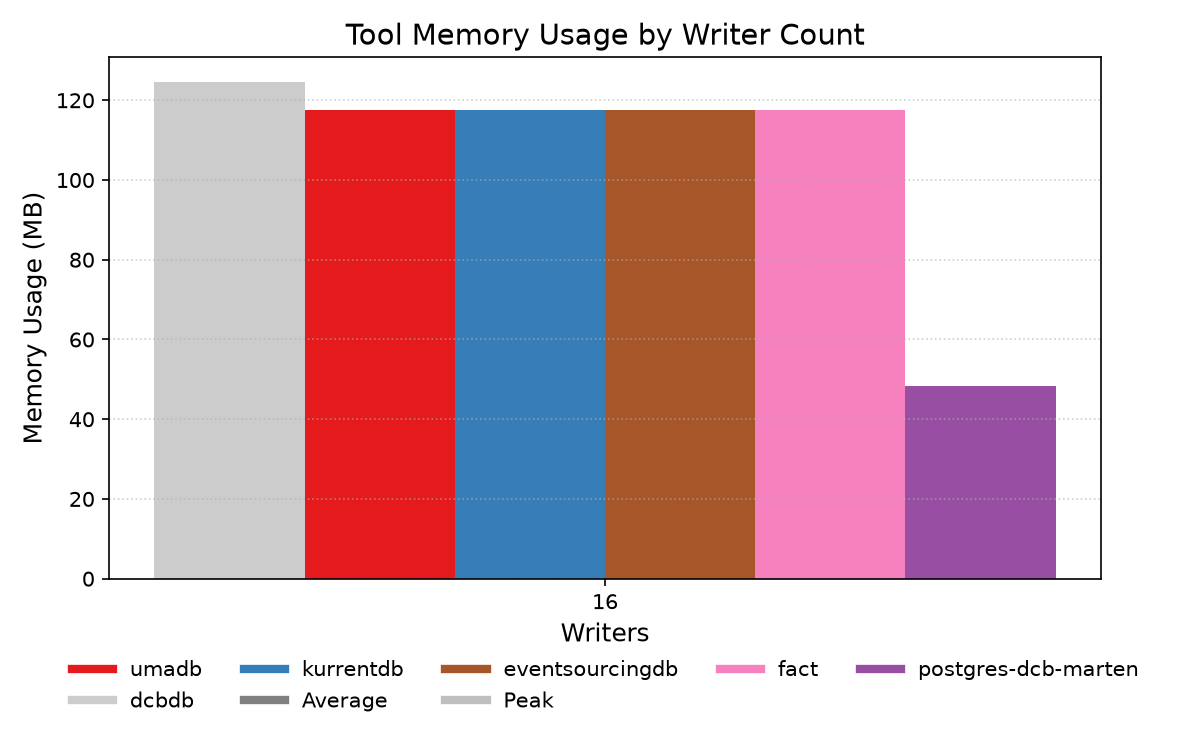
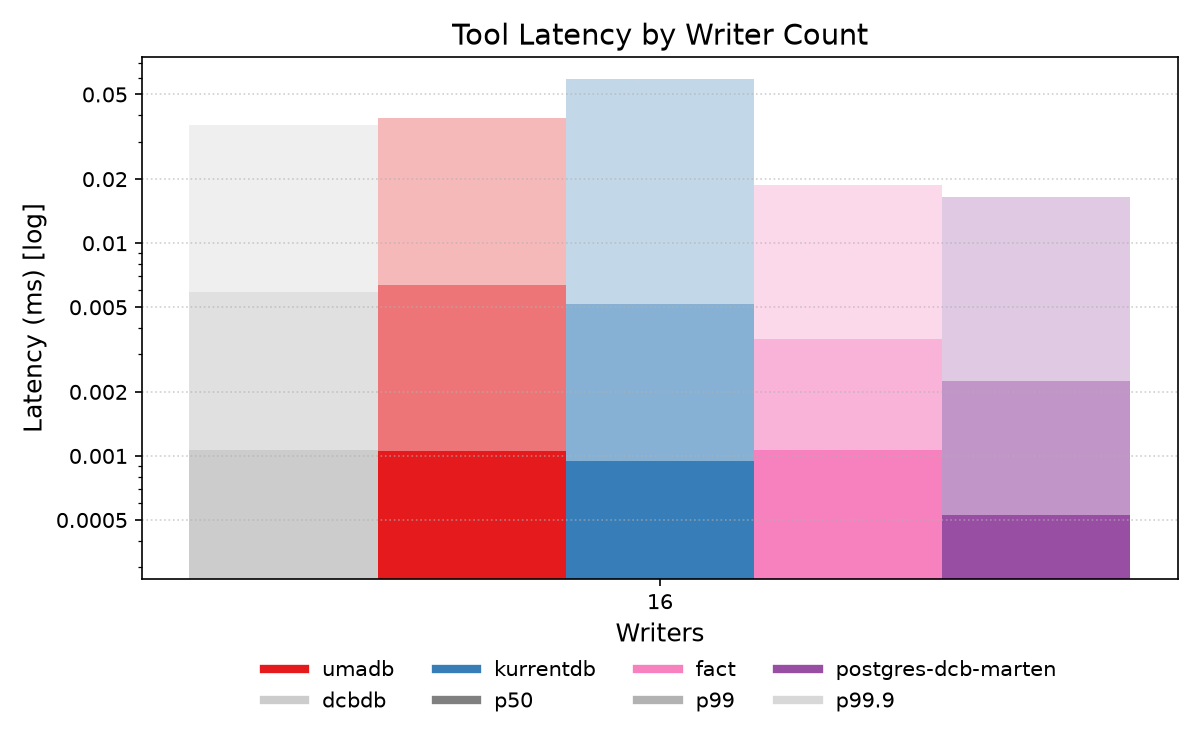
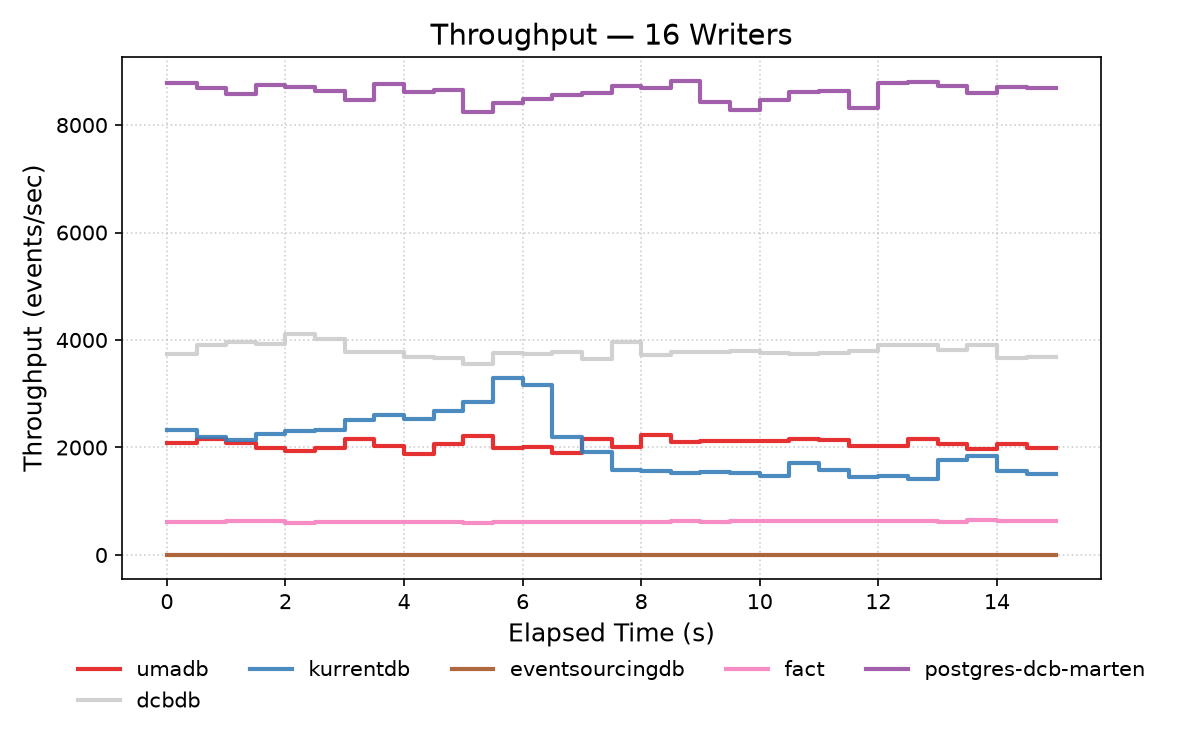
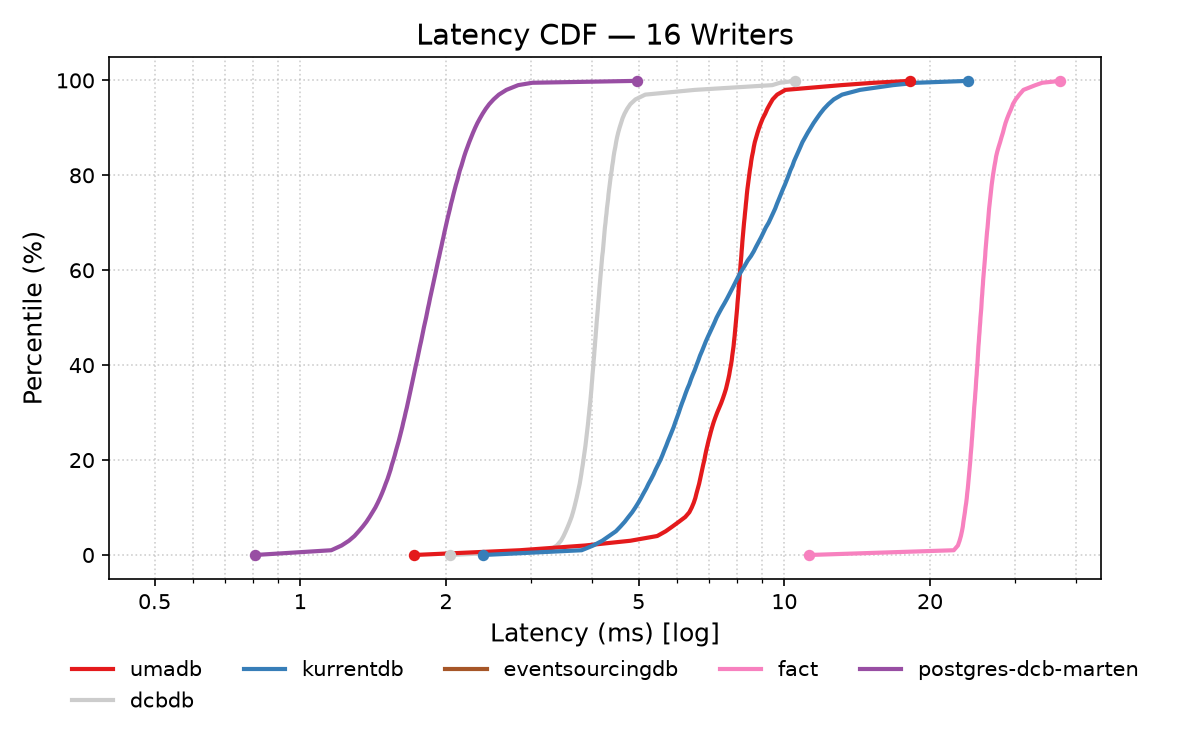
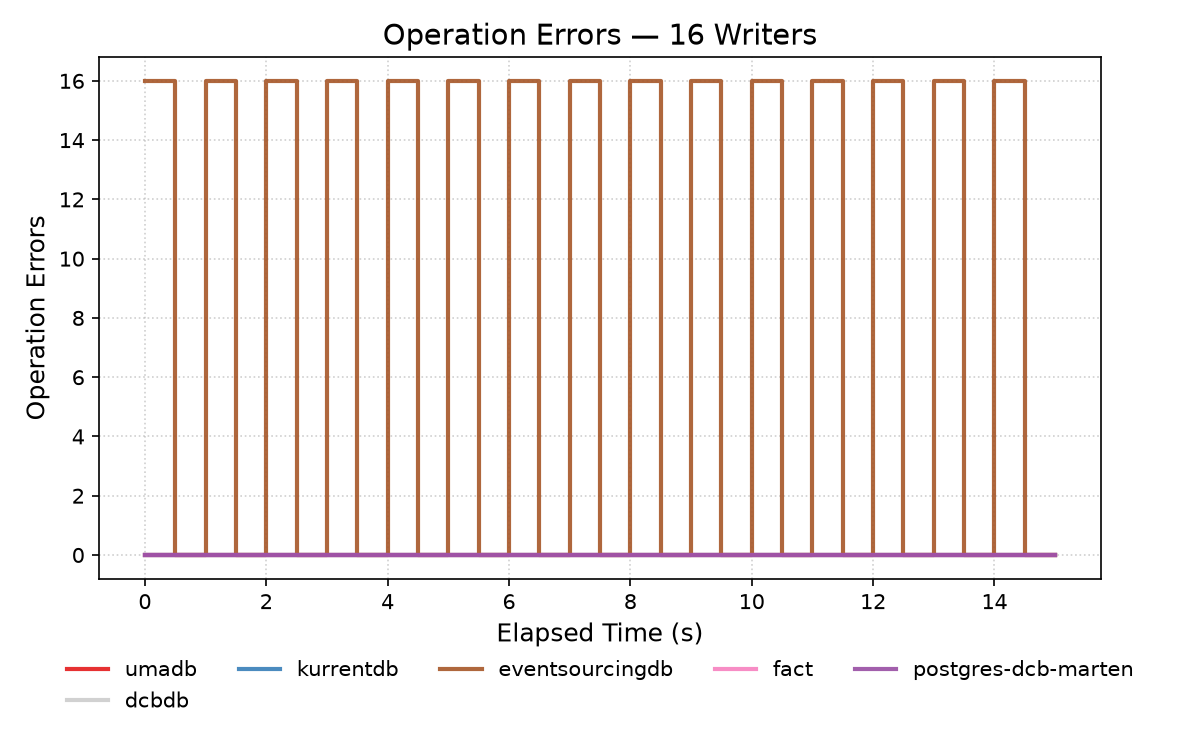
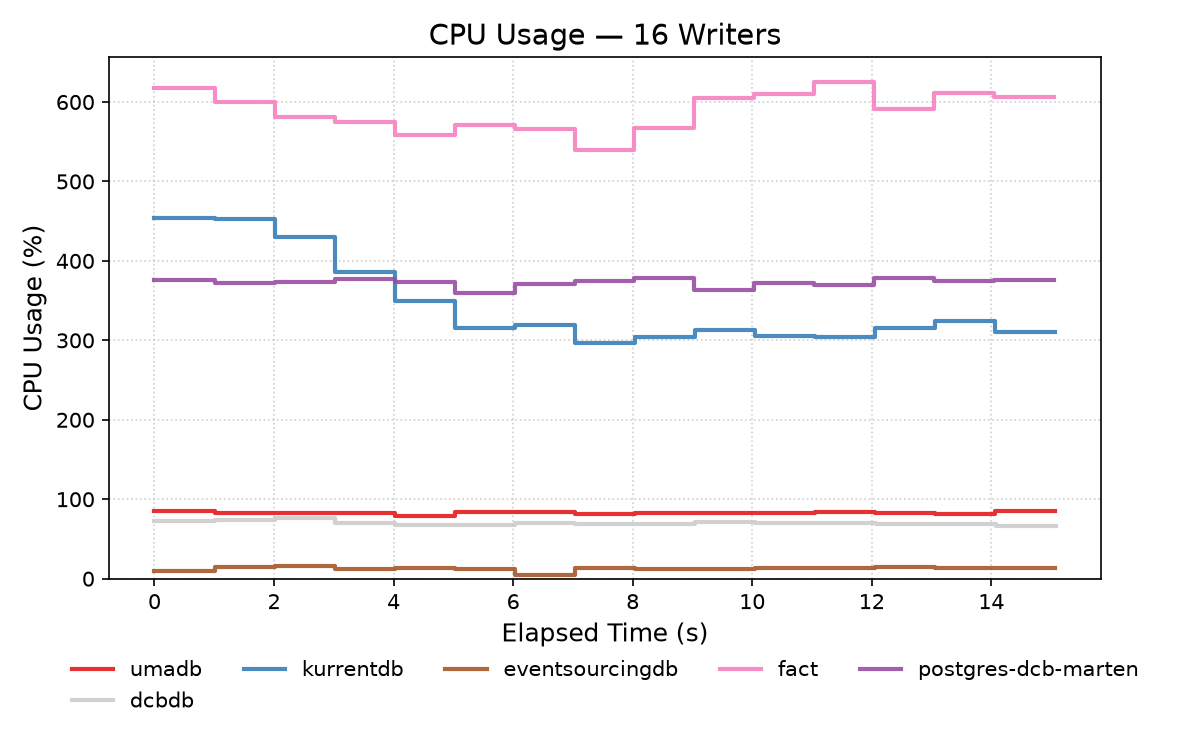
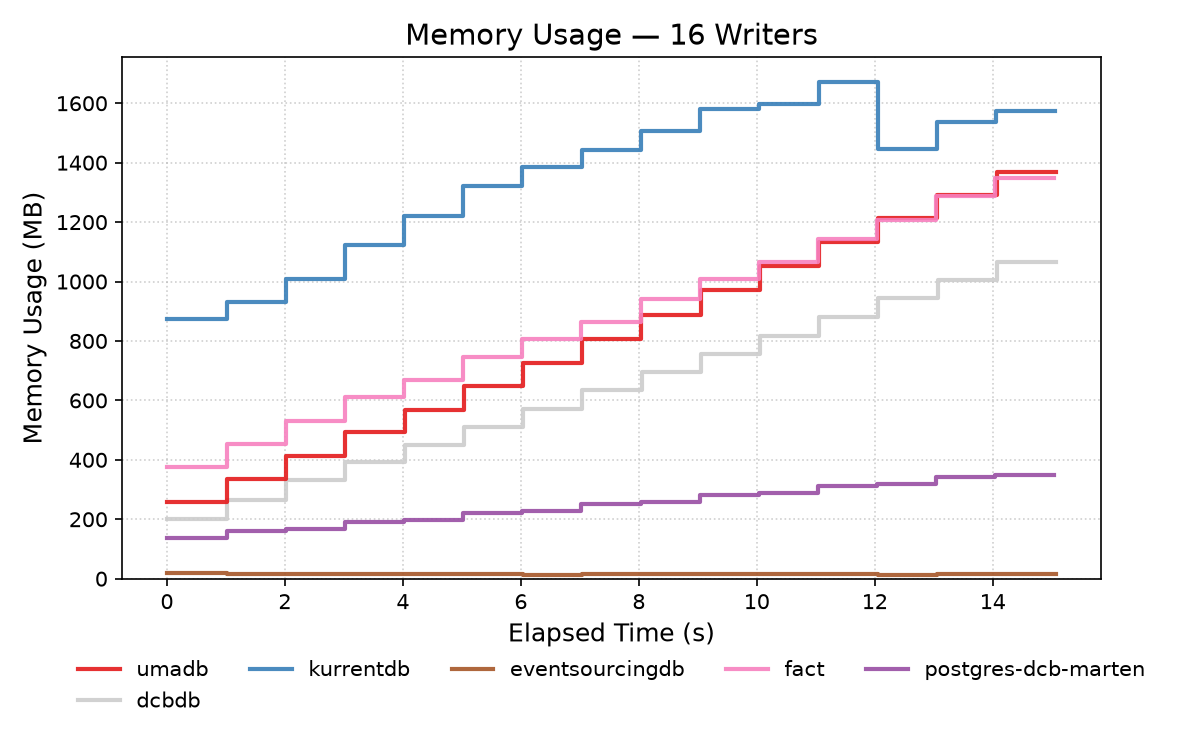
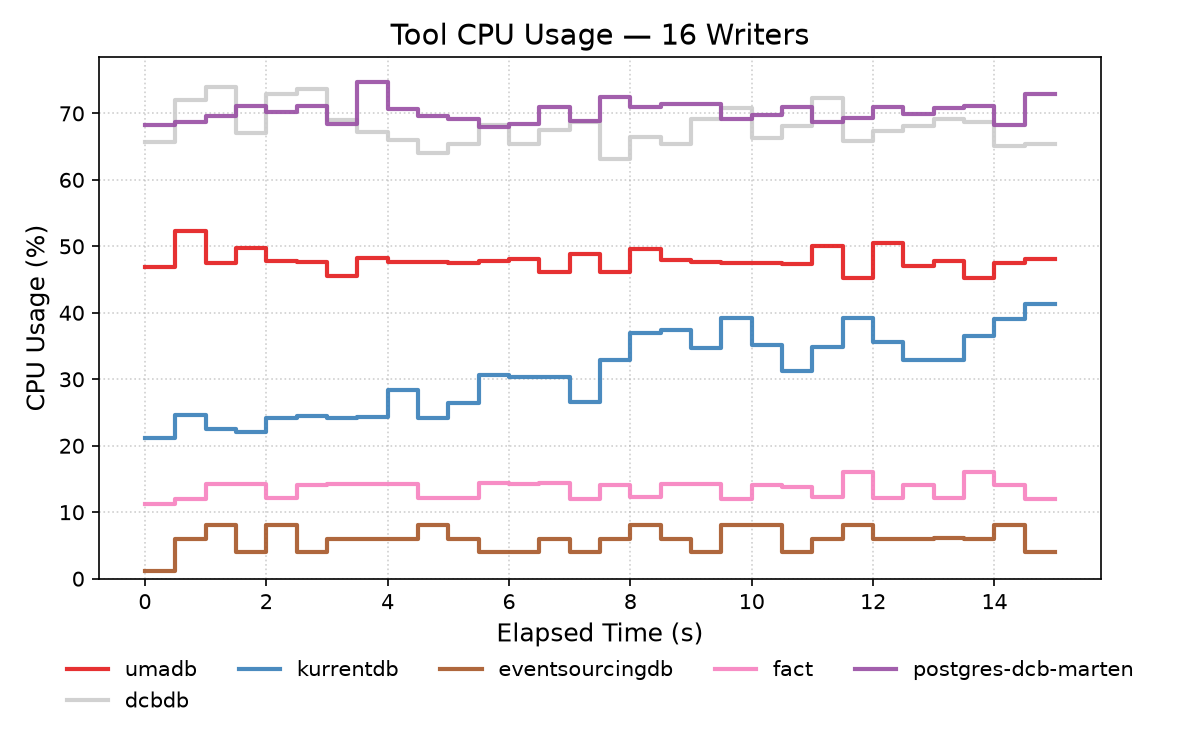
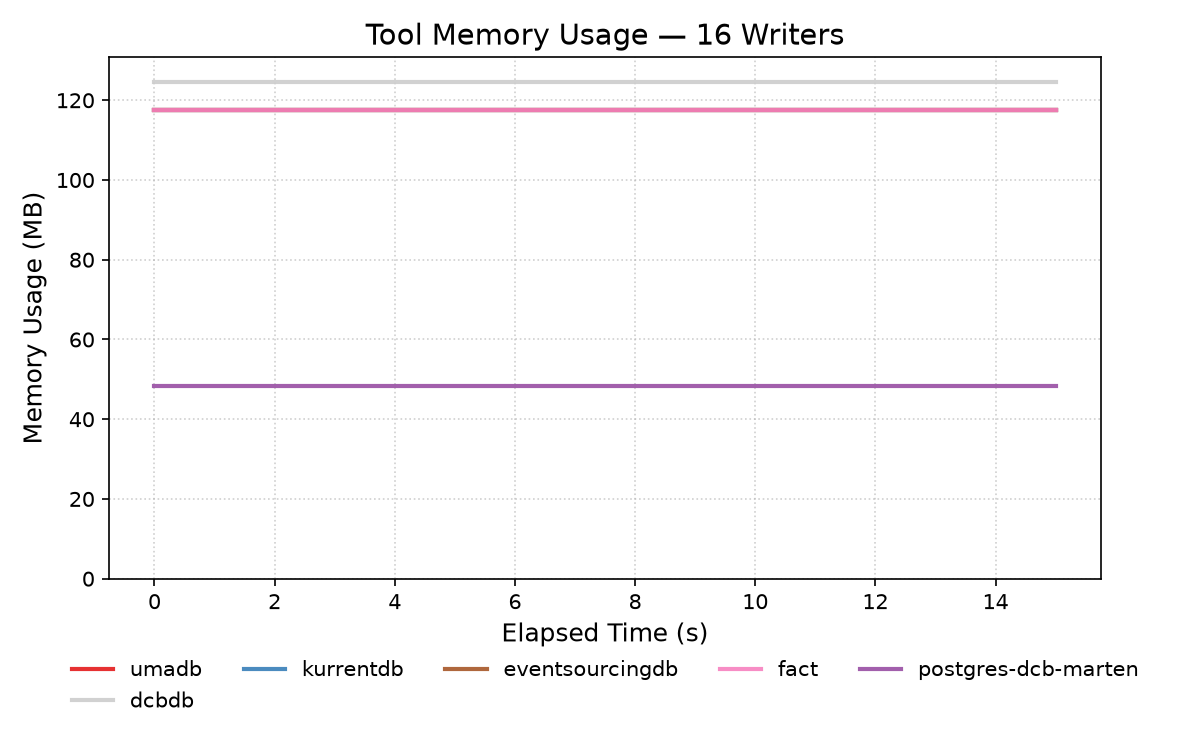
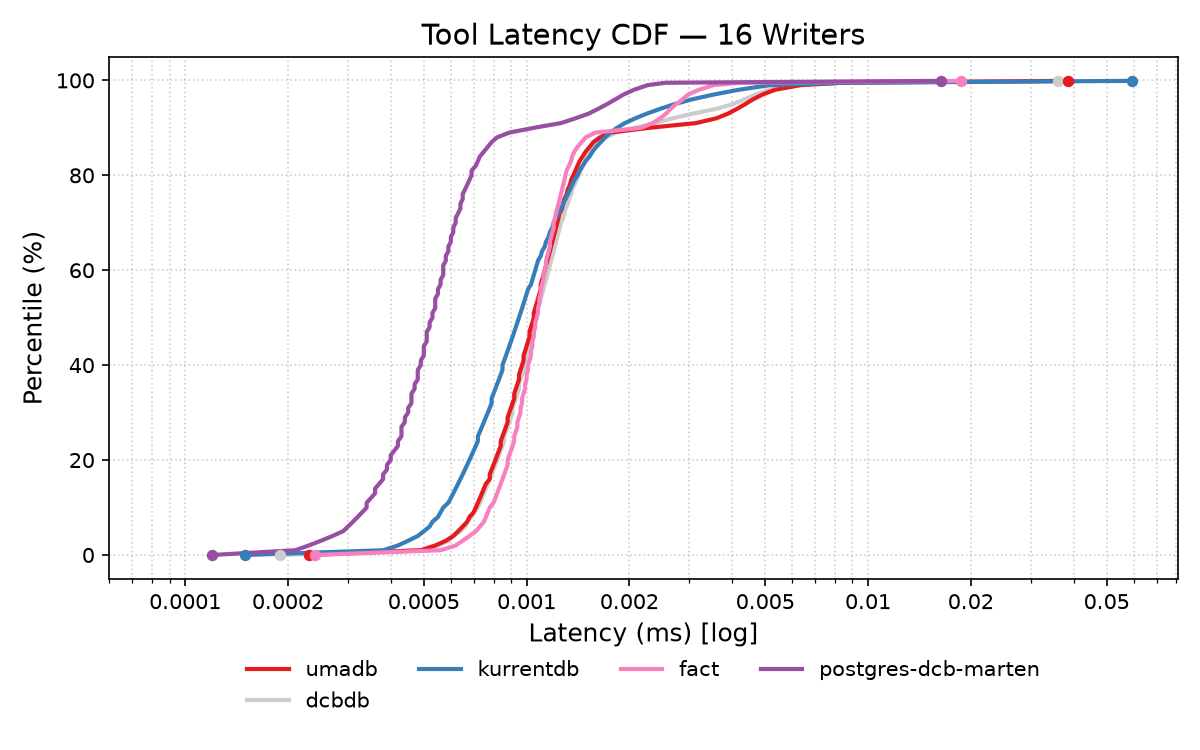
| Adapter | Writers | Throughput (eps) | Operation Errors | p50 (ms) | p99 (ms) | p99.9 (ms) | CPU (avg/peak) | Mem MB (avg/peak) |
|---|---|---|---|---|---|---|---|---|
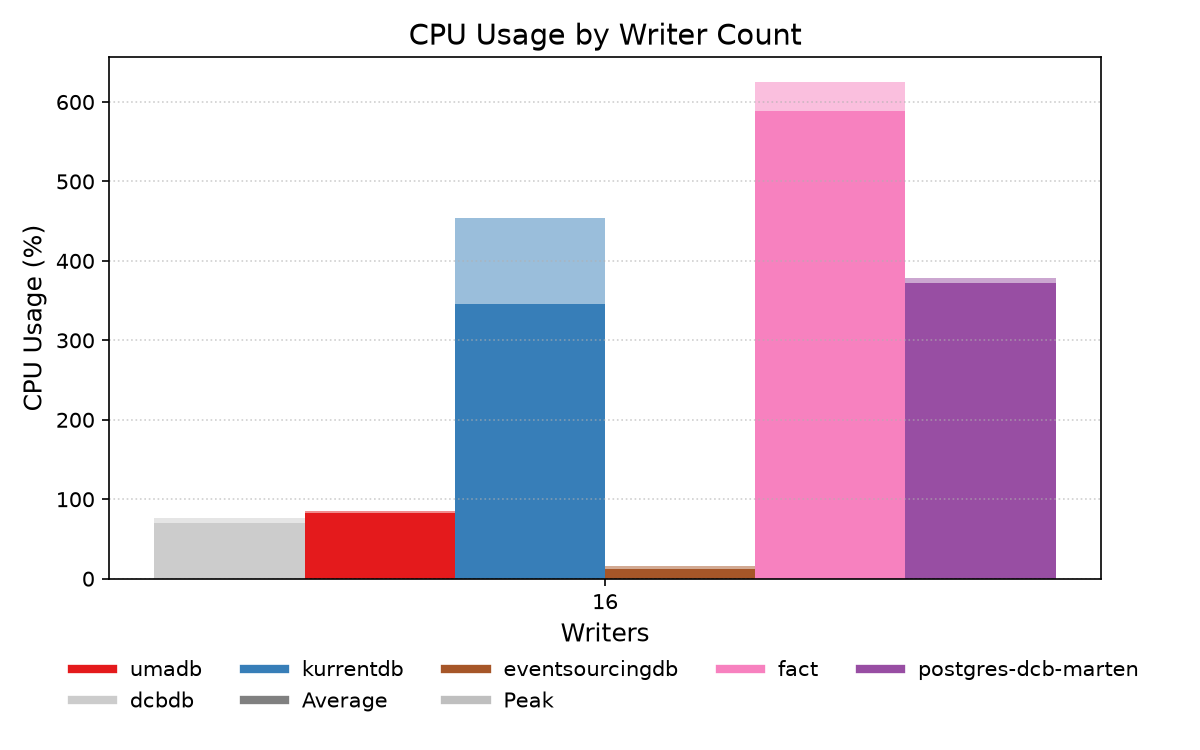
| dcbdb | 16 | 3801 / 4016 | 0 | 4.10 | 9.45 | 10.52 | 70.1% / 75.9% | 635 / 1066 |
| umadb | 16 | 2063 / 2147 | 0 | 7.96 | 13.11 | 18.19 | 82.9% / 84.8% | 810 / 1367 |
| kurrentdb | 16 | 2026 / 3098 | 0 | 7.25 | 16.78 | 24.02 | 345.6% / 454.5% | 1348 / 1672 |
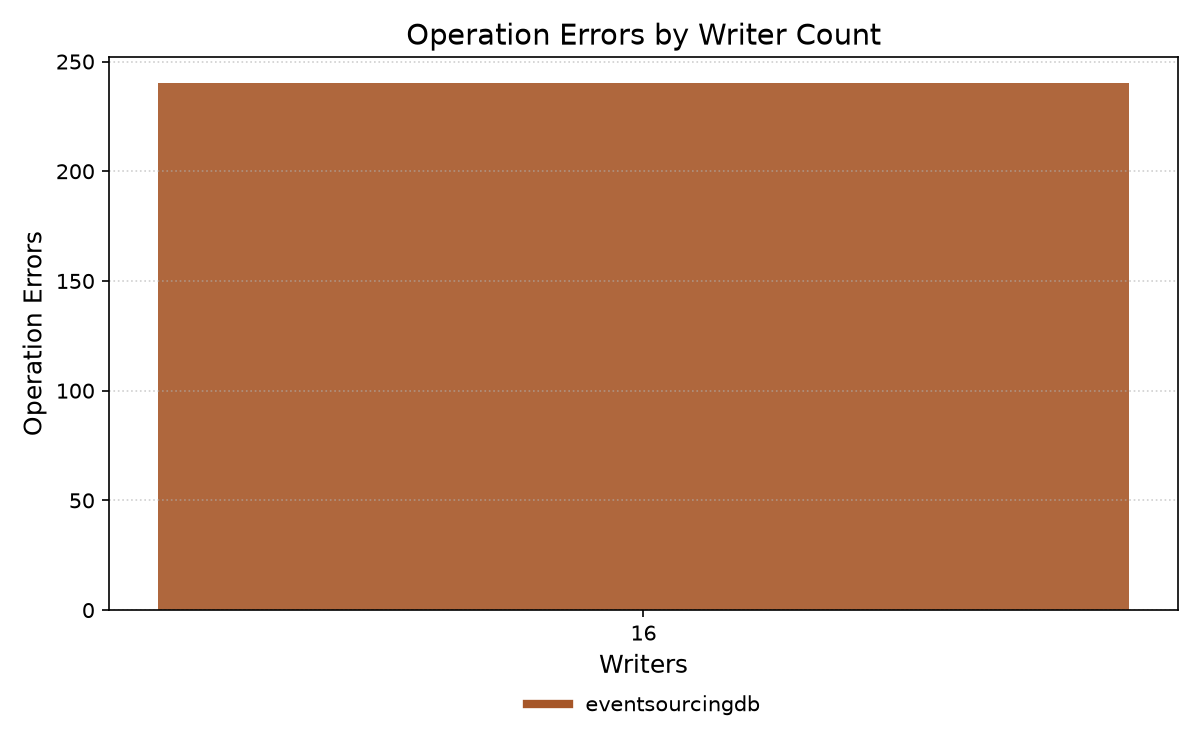
| eventsourcingdb | 16 | 0 | 240 | 0.00 | 0.00 | 0.00 | 12.5% / 15.6% | 15 / 18 |
| fact | 16 | 621 / 637 | 0 | 25.43 | 33.03 | 37.19 | 588.4% / 625.2% | 871 / 1347 |
| postgres-dcb-marten | 16 | 8606 / 8767 | 0 | 1.82 | 2.82 | 4.96 | 372.6% / 378.1% | 248 / 350 |
performance:
  concurrency:
    writers:
    - 16
  duration_seconds: 15
  mode: write
  name: wp-16384
  operations:
    write:
      append_condition: none
      event_size_bytes: 16384
  samples_per_second: 2
  stores:
  - dcbdb
  - umadb
  - kurrentdb
  - eventsourcingdb
  - fact
  - postgres-dcb-marten
  use_docker: true
  warmup_seconds: 2